
Shake Shack Inc. (NYSE:SHAK) posted strong second-quarter 2017 results, wherein both earnings and revenues beat the Zacks Consensus Estimate.
However, the company’s shares have dropped nearly 1% in afterhours trading on Aug 3 as comps declined in the quarter.
Earnings and Revenue Discussion
Shake Shack’s adjusted earnings of 20 cents per share surpassed the Zacks Consensus Estimate of 16 cents by 25%, and climbed 42.9% year over year. The year -over-year growth reflects an increase in revenues.
Revenues surged 37.4% year over year to $91.3 million and topped the Zacks Consensus Estimate of $89.9 million by 1.6%. An increase in Shack sales and licensing revenues, led to the improvement.
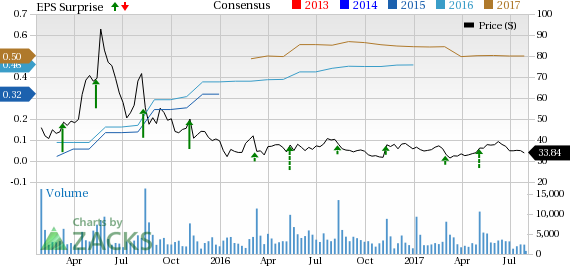
Shake Shack, Inc. Price, Consensus and EPS Surprise
Behind the Headline Numbers
Same-Shack sales (or comps) declined 1.8% year over year, due to a 4.3% decrease in guest traffic partly offset by a combined increase in price and sales mix of 2.5%. Comps compared favorably with prior-quarter comps decline of 2.5%, and unfavorably with the prior-year quarter rise of 4.3%.
Notably, unfavorable weather conditions in the Northeast region that makes up a high percentage of the company’s sales have hurt comps.
Total operating expenses, as a percentage of revenues, increased 50 basis points (bps) to 87.1% mainly on a 180 bps increase in labor costs, 30 bps rise in other operating expenses and 70 bps increase in depreciation expenses.
However, these were somewhat offset by a decline of 70 bps and 100 bps in general and administrative expenses (G&A) and pre-opening costs, respectively.
As a percentage of Shack sales, Shack-level operating profit margins decreased 200 bps to 28.8% primarily due to increased labor and related expenses.
Adjusted EBITDA (earning before interest, tax, depreciation and amortization) surged 36.4% to $19.4 million. However, as a percentage of total revenue, adjusted EBITDA margins decreased roughly 20 bps to 21.2% from 21.4% in the year-ago quarter.
2017 Outlook
The company continues to expect revenues in the range of $351 million to $355 million.
Meanwhile, it projects Same-Shack sales to decrease between 2% and 3%, down from the previous expectation of comps being flat year over year. Notably, this includes roughly 1.5% to 2% of menu price increases taken at the end of Dec 2016.
Shack-level operating profit margin is still guided between 26.5% and 27.5%, while general and administrative expenses are anticipated between $38 million and $40 million.
The company continues to expect opening of 23 to 24 new domestic company-operated Shacks in 2017. Currently, it expects 15 net new licensed Shacks, up from 12 announced earlier.
Zacks Rank & Peer Releases
Shake Shack currently carries a Zacks Rank #3 (Hold). You can see the complete list of today’s Zacks #1 Rank (Strong Buy) stocks here.
Among other restaurant stocks, McDonald's Corp. (NYSE:MCD) reported second-quarter adjusted earnings per share of $1.73, beating the Zacks Consensus Estimate of $1.62 by 6.79%. The bottom line also increased 19% year over year.
Chipotle Mexican Grill, Inc.’s (NYSE:CMG) second-quarter 2017 adjusted earnings were $2.32 per share, which outpaced the Zacks Consensus Estimate of $2.16 by 7.41%. Also, earnings compared favorably with the year-ago quarter figure of 87 cents per share, given a substantial rise in revenues.
In second-quarter 2017, Domino’s Pizza, Inc. (NYSE:DPZ) posted earnings of $1.32 per share, which outpaced the Zacks Consensus Estimate of $1.22 by 8.20%. Furthermore, earnings increased 34.7% year over year on strong sales and a lower share count.
Today's Stocks from Zacks' Hottest Strategies
It's hard to believe, even for us at Zacks. But while the market gained +18.8% from 2016 - Q1 2017, our top stock-picking screens have returned +157.0%, +128.0%, +97.8%, +94.7%, and +90.2% respectively.
And this outperformance has not just been a recent phenomenon. Over the years it has been remarkably consistent. From 2000 - Q1 2017, the composite yearly average gain for these strategies has beaten the market more than 11X over. Maybe even more remarkable is the fact that we're willing to share their latest stocks with you without cost or obligation. See Them Free>>
Chipotle Mexican Grill, Inc. (CMG): Free Stock Analysis Report
Domino's Pizza Inc (DPZ): Free Stock Analysis Report
McDonald's Corporation (MCD): Free Stock Analysis Report
Shake Shack, Inc. (SHAK): Free Stock Analysis Report
Original post