‘s analysis of final business sales data (retail plus wholesale plus manufacturing) for September 2012 is not as good as the headline data.
- business sales remain in a long term downtrend.
- The inventory levels have been slightly on the high side for three months – but is not sending any warning signals.
- This is a record current dollar month for sales – with a record sales in 13 of the last 14 months. Note that real (inflation adjusted) dollars are used in GDP, and the headlines are not inflation adjusted. The inflation adjusted data is showing year-over-year contraction.
- sales down 2.3% month-over-month, and up 0.9% year-over-year
- sales (inflation adjusted) down 3.4% month-over-month, down 0.7% year-over-year
- retail inventories up 1.4% month-over-month (up 6.0% year-over-year), inventory-to-sales ratios 1.30 which is historically within the normal channel for Augusts, but on the high side. It has been on the high side for three months in a row.
- sales up 1.4% month-over-month, up 3.1% year-over-year
- inventories up 0.7% month-over-month (up 4.4% year-over-year), inventory-to-sales ratios were up from 1.25 one year ago – and are now 1.28.
- market expected inventories to be up 0.6% (actual 0.7%)
The way data is released, differences between the business releases pumped out by the U.S. Census Bureau are not easy to understand with a quick reading. The entire story doesn’t really come together until the Business Sales Report (this report) comes out. At this point, a coherent and complete business contribution to the economy can be understood.
Today, Econintersect analyzed advance retail sales for October 2012. That is early data for the month after the data for this post. This is final data from the Census Bureau for September 2012 for manufacturing, wholesale, and retail:
Year-over-Year Change Manufacturing New Orders – Unadjusted (blue line) and Inflation Adjusted (red line)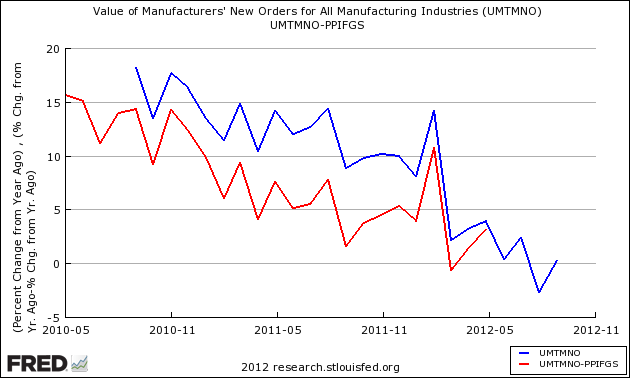
Year-over-Year Growth – Wholesale Sales – Unadjusted data (blue line) & Inflation Adjusted Data (red line)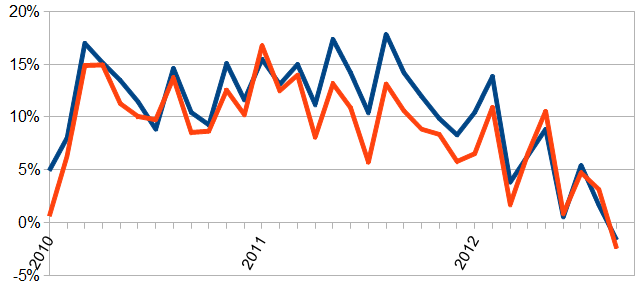
Year-over-Year Change – Unadjusted Retail Sales (blue line) and Inflation Adjusted Retail Sales (red line)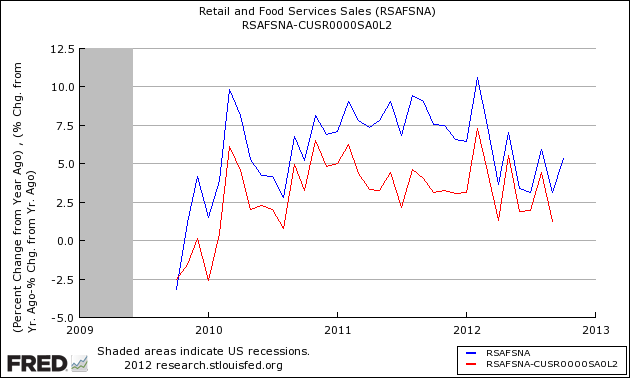
The Headlines:
Sales: The U.S. Census Bureau announced today that the combined value of distributive trade sales and manufacturers’ shipments for September, adjusted for seasonal and trading-day differences but not for price changes, was estimated at $1,263.9 billion, up 1.4 percent (±0.2%) from August 2012 and up 4.4 percent (±0.4%) from September 2011.
Inventories: Manufacturers’ and trade inventories, adjusted for seasonal variations but not for price changes, were estimated at an end-of-month level of $1,612.9 billion, up 0.7 percent (±0.1%) from August 2012 and up 6.2 percent (±0.4%) from September 2011.
Inventories/Sales Ratio: The total business inventories/sales ratio based on seasonally adjusted data at the end of September was 1.28. The September 2011 ratio was 1.25.
Please see caveats at the end of this post on the differences between Econintersect data analysis methodology and U.S. Census.
Business Sales – Unadjusted – $ millions
This is a record current dollar month for sales – with a record sales in 13 of the last 14 months.
Inflation adjusted business sales have been quite noisy but sales are in a down trend. This month shows a year-over-year contraction.
Year-over-Year Change Business Sales – Unadjusted (blue line) and Inflation Adjusted (red line)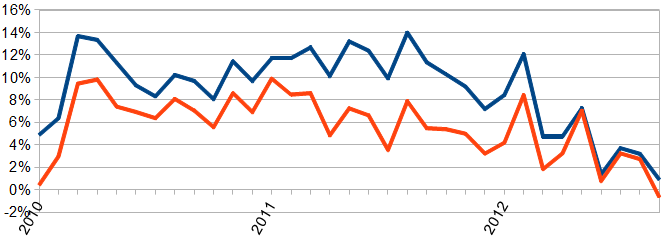
Using inflation adjustments, analysts can more clearly count the quantity of business transactions. Inflation adjusted data being negative is telling that real sales are contracting and could be a recession flag.
Many analysts pay particular attention to inventories in this report. Inventories, expressed as a ratio to sales, remain well within the historical levels. A unusual rise in this ratio would suggest the economy was contracting.
Business Inventories Year-over-Year Change – Inventory Value (blue line) and Inventory-to-Sales Ratio (red line)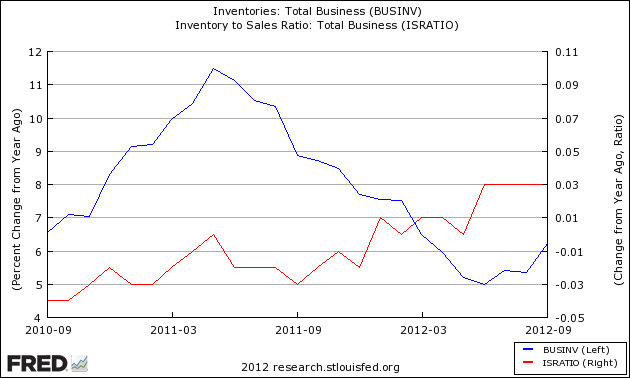
The takeaway from the above graph is that overall inventories growth is “less good”, but business sales are even more “less good” as the inventory-to-sales ratios have a slight growth bias. Admittedly, this is slight upward bias in the inventory-to-sales ratios is so slight that it is statistically insignificant.
The above graph is the headline view of inventories. Econintersect uses unadjusted data to look at inventories. To do so, you need to compare ONLY the data results in the month of the data release – and DO NOT compare one month against another. A high ratio is good if you are looking for recession evidence.
Unadjusted Inventory-to-Sales Ratio
Caveats On Business Sales
This data release is based on more complete data than the individual releases of retail sales, wholesale sales and manufacturing sales. Backward revisions are slight – and it is unusual that the revisions would cause a different interpretation of a trend analysis.
The data in this series is not inflation adjusted by the Census Bureau – Econintersectadjusts using the appropriate BLS price indices relative to the three data series.
- CPI less shelter for retail sales
- PPI subindex OMFG for manufacturing
- PPI subindex PCUAWHLTRAWHLTR for wholesale sales
As in most U.S. Census reports, Econintersect questions the seasonal adjustment methodology used and provides an alternate analysis. The issue is that the exceptionally large recession and subsequent economic roller coaster has caused data distortions that become exaggerated when the seasonal adjustment methodology uses more than one year’s data. Further, Econintersect believes there is a New Normal seasonality and using data prior to the end of the recession for seasonal analysis could provide the wrong conclusion.
