Selling cash-secured puts requires us to master the three required skills: stock (or ETF) selection, option selection and position management. This article will highlight how to select a put strike based on our overall market assessment.
Market assessment data published in BCI newsletters
- Investor Business Daily’s market assessment
- Dr. Eric Wish’s GMI Index
- BCI market assessment
Each investor must establish criteria for determining market tone and categorize this parameter as bullish, neutral or bearish.
Pros and cons of various put strikes
For most of us who use puts to generate monthly (or weekly) cash flow or to buy stocks at a discount, we focus in on out-of-the-money put strikes. These are strike prices lower than current market value. In addition to generating put premium income, we will also have downside protection if share price should decline. Near-the-money (slightly below current market value) will generate the highest initial premium returns but give us the smallest amount of downside protection. These should be favored in neutral to bull market environments. Deeper out-of-the-money put strikes (much lower than current market value) should be considered in bear or volatile market scenarios.
We must first set a range for initial premium returns. Let’s say our range for initial returns is from 1-4% per month. To evaluate a real-life example, I have selected Applied Materials (NASDAQ:AMAT), a stock on our Premium Stock List as of 5/17/2017.
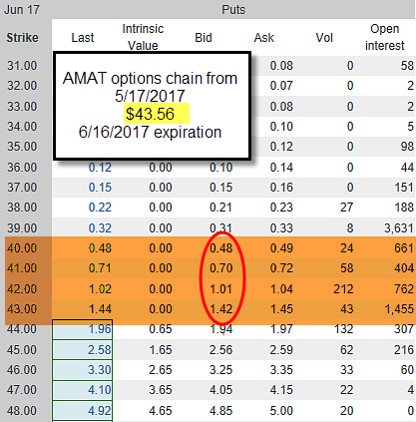
Options chain for AMAT as of 5/17/2017

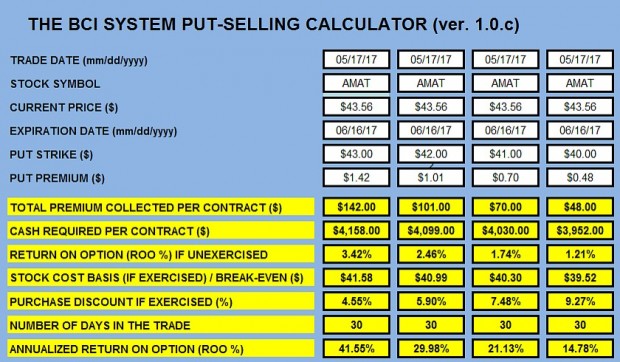
With AMAT trading at $43.56 on 5/17/2017, we view the out-of-the-money $43.00, $42.00, $41.00 and $40.00 strikes. The published bid prices range from $1.42 to $0.48 per share. Note that the bid-ask spreads are small so negotiating with the market-makers by leveraging the Show or Fill Rule does not apply here. The deeper out-of-the-money we go, the lower the option premium. Next, we enter this information into the BCI Put Calculator (click on link for a free copy of the single-column BCI Put Calculator):
Put calculations for AMAT as of 5/17/2017

Let’s focus in on the two extremes, the $43.00 closest-to-the-money strike and the $40.00 furthest-from-the-money strike.
$43.00 put strike
This strike generates an unexercised return of 3.42% or 41.55% annualized. If exercised, shares are purchased at a cost basis of $41.58 or a 4.55% discount from the original price of $43.56.
$40.00 put strike
This strike generates an unexercised return of 1.21% or 14.78% annualized. If exercised, shares are purchased at a cost basis of $39.52 or a 9.27% discount from the original price of $43.56.
Matching strikes with market assessment
In a bull market environment, we would favor the $43.00 which yields a higher unexercised return. With a positive market tone, shares are less likely to move below the strike. In a bear market, we would favor the $40.00 strike where share value would have to decline by more than 9.27% before we start losing money. View these decisions as a negotiation where we base our choices on the tone of the market at the time. We can adjust on a monthly basis. Chart technical will also play a role in our bullish/bearish strike price decisions.
Discussion
DuPont (NYSE:DWDP) has a new ticker symbol
DD is now DWDP: DuPont from our Blue Chip Report:
Shares of DuPont and Dow ceased trading at the close of the New York Stock Exchange (NYSE) on Aug. 31, 2017. DowDuPont will start trading on the New York Stock Exchange under the stock ticker symbol DWPD. Pursuant to the merger agreement, Dow shareholders received a fixed exchange ratio of 1.00 share of DowDuPont for each Dow share, and DuPont shareholders received a fixed exchange ratio of 1.282 shares of DowDuPont for each DuPont share.
Market tone
Global stocks rose modestly this week. The price of West Texas Intermediate crude oil rose to $49.87 from last Friday’s 47.59 while the Chicago Board Options Exchange Volatility Index (VIX) declined to 10.17 from 12.34. This week’s economic and international news of importance:
- In response to North Korea’s nuclear test conducted a week ago, the United Nations Security Council unanimously voted to adopt US draft resolution to impose new sanctions
- The yuan strengthened 6.7% against the US dollar this year, recovering all of last year’s decline of 6.6%. However, the surge is causing a drag on China’s export growth and threatening to deplete profits for many manufacturers selling in foreign markets
- The Bank of England voted to keep interest rates at 0.25% but indicated that inflationary pressures may prompt an increase in the coming months. British inflation increased to 2.9% in August, well above the central bank’s target of 2
- UK unemployment fell to 4.3%, the lowest level in more than 40 years, but wage growth continued to lag behind price increases
- In response to the surge in gasoline and housing rental prices, the US Consumer Price Index rose by 0.4% in August, up from 0.1% in July, and increased 1.9% year on year compared with July’s 1.7%
- Gasoline prices increased 6.3% and are expected to rise further in September as a result of the temporary closure of refineries in the wake of Hurricane Harvey
- US median household income sustained strong growth for the second consecutive year, rising to 59,039, a 3.2% more than a year earlier
- Poverty levels fell to 12.7%, the lowest level since 2007
- August retail sales were down 0.2% month over month, below consensus expectations of a 0.2% rise and worse than July’s downwardly revised 0.3% increase
- Auto sales decreased 1.6% month over month, possibly as a result of Hurricane Harvey
- The Empire manufacturing index for September beat expectations, coming in at 24.4 versus the 18.0 expected
- Labor market indicators pointed to a modest increase in employment and hours worked, and both input and selling prices rose at a faster pace than last month
- Moody Analytics estimates that damage caused by hurricanes Irma and Harvey could cost between $150 billion and $200 billion to repair. As a result, Moody’s expects US GDP to decline a half point to 2.5% for the third quarter but added that it expects fourth-quarter GDP to rally
- At its September policy meeting, the US Federal Reserve will most likely hold interest rates steady at 1.25%. Fed officials are also expected to announce when they will start to reduce the central bank’s $4.5 trillion balance sheet
- The scope and timing of any tax reform remains unclear. At a Politico event on Thursday, US secretary of the treasury Secretary Mnuchin said that a widely anticipated blueprint on taxes due from the “Big Six” group of senators late this month will propose a specific corporate tax rate and discuss in detail the deductibility of corporate interest
THE WEEK AHEAD
Mon, Sep 18th
- Eurozone: Consumer Price Index
Tue, Sep 19th
- None
Wed, Sep 20th
- UK: Retail sales
- US: Fed interest rate decision
Thu, Sep 21st
- Japan: BOJ interest rate decision
Fri, Sept 22nd
- Canada: Retail sales and Consumer Price Index
For the week, the S&P 500 rose by 1.58% for a year-to-date return of 11.68%
Summary
IBD: Market in confirmed uptrend
GMI: 6/6- Buy signal since market close of August 31, 2017
BCI: I am currently favoring in-the-money strikes 2-to-1.
WHAT THE BROAD MARKET INDICATORS (S&P 500 AND CBOE Volatility Index) ARE TELLING US
The 6-month charts point to a neutral to slightly bullish outlook. In the past six months, the S&P 500 was up 5% while the VIX (10.17) moved down by 12.5%.
Much success to all,
