


Sign up to create alerts for Instruments,
Economic Events and content by followed authors
Free Sign Up Already have an account? Sign In
Please try another search

Short-term sector performance is changing from a late-cycle orientation to a more bullish alignment.
Longer-term performance is still late-cycle.
I take a deeper look at the basic materials sector.
Just to set this week's column up, over the last few months, we've seen the sector performance take on a decidedly late-cycle orientation, with healthcare, utilities, and consumer staples outperforming other sectors. Let's see if that's still the case, shall we?
It has been forever - I mean forever - since basic materials were at the top of the list. That is a beginning of the expansion orientation, not late. financials are late cycle, but energy isn't, nor are industrials. In fact, staples, healthcare, and utilities were in the lower half of the performance table this week.
We see the same situation developing on the one-month performance chart:
Industrial are leading the pack. Healthcare is still second, but basic materials are now number three followed by the energy sector and consumer discretionary. In fact, staples and utilities are again in the bottom half of the table.
And we're even seeing some changes in the three-month performance table:
Here we still see a late-cycle orientation, with healthcare, staples, and utilities occupying the 1st, 2nd, and 4th slot. This is to be expected; it takes longer for shorter-term changes to filter through into the longer-term performance statistics.
The 10-week performance graph still has a late-cycle orientation; staples and healthcare are still leading. Financials are also improving. But now we see industrials making a move, while basic materials took a hard turn to the north. Utilities are now weakening.
So what's going on here? Let's start by looking at the daily chart for the XLBs:
Prices were moving sideways right above the 200-day EMA since mid-April. They've bounced off that technically important line four times since the mid-spring. It shouldn't be surprising that the sector hasn't been able to maintain any upside momentum. Basic materials usually rally at the beginning of an expansion as traders buy the shares in anticipation that manufacturers will start to increase their production as the economy expands. The trade war between the U.S. and, well, everybody, is also hurting. Over the last week, prices jumped, gapping higher mid-week. They are now in the lower 60s, an area of technical resistance.
Within the 10 largest XLB holdings, we're seeing come solid rallies:
Six charts: Air Products (upper left) (APD), Ecolab (ECL) (top row, second from right), International Paper (second row, far left) (IP), PPG Industries (NYSE:PPG) (second row, far right), Praxair (NYSE:PX) (bottom row, left) and Sherwin-Williams (bottom row, right) (SHW) have short- or longer-term uptrends. Freeport-McMoRan (top row, far right) (FCX) has printed a short-term rally.
This isn't a value play: the larger issues that are doing well are already expensive:
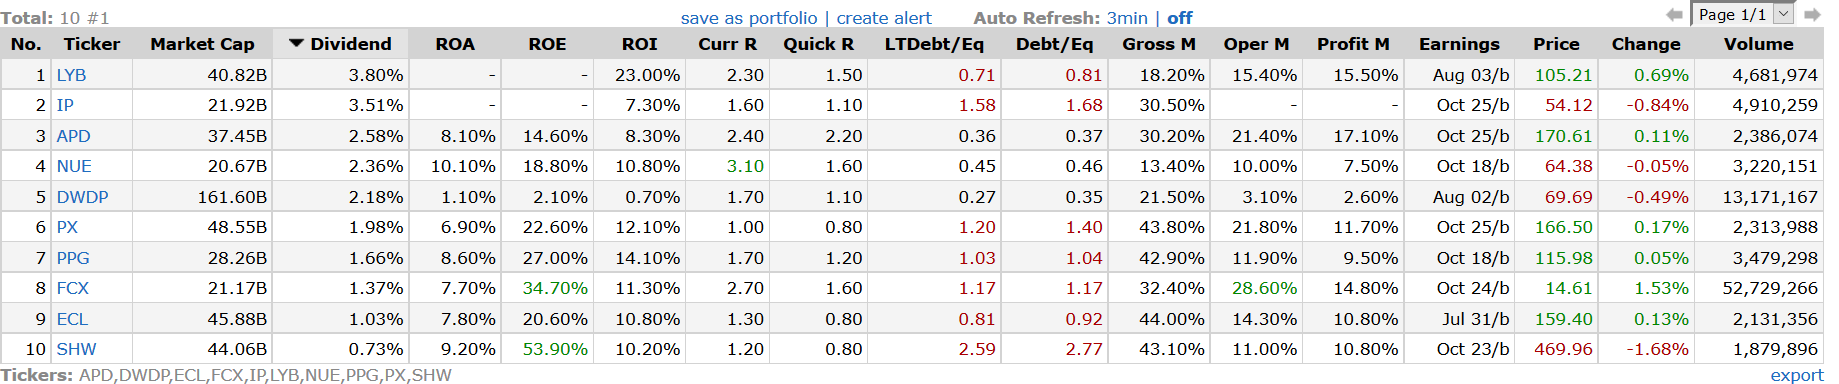
It is possible, however, that somewhat attractive dividend yields are at least partially driving this trade:
Two issues are over 3%; three others have yields over 2%.
So is this the beginning of a new trend or the nothing more than a short-term development? I tend to think the latter. According to Markit's PMI indexes, the global manufacturing sector has been doing well for the last 18-24 months (the US manufacturing sector has been doing well for the same length of time); if that development was the cause of the rally, then the XLBs would have moved higher sooner. This looks to me like nothing more than a short-term bump.
Disclosure: I/we have no positions in any stocks mentioned, and no plans to initiate any positions within the next 72 hours.
I wrote this article myself, and it expresses my own opinions. I am not receiving compensation for it (other than from Seeking Alpha). I have no business relationship with any company whose stock is mentioned in this article.
If there was a "Stock of the Year" award, it would certainly go to Nvidia (NASDAQ:NVDA). As a result of the continued AI boom, the market cap of this semiconductor manufacturer...
A data provider tracks the stocks trades of members of Congress An asset management firm created two ETFs tracking how Congress members invest The Democratic and...
Below we can see how the top stocks in the S&P 500, as tracked by the Invesco S&P 500® Top 50 ETF (NYSE:XLG), have gained 22.5% in 2024. That easily beats the SPDR®...
Are you sure you want to block %USER_NAME%?
By doing so, you and %USER_NAME% will not be able to see any of each other's Investing.com's posts.
%USER_NAME% was successfully added to your Block List
Since you’ve just unblocked this person, you must wait 48 hours before renewing the block.
I feel that this comment is:
Thank You!
Your report has been sent to our moderators for review


Add a Comment
We encourage you to use comments to engage with other users, share your perspective and ask questions of authors and each other. However, in order to maintain the high level of discourse we’ve all come to value and expect, please keep the following criteria in mind:
Enrich the conversation, don’t trash it.
Stay focused and on track. Only post material that’s relevant to the topic being discussed.
Be respectful. Even negative opinions can be framed positively and diplomatically. Avoid profanity, slander or personal attacks directed at an author or another user. Racism, sexism and other forms of discrimination will not be tolerated.
Perpetrators of spam or abuse will be deleted from the site and prohibited from future registration at Investing.com’s discretion.