Stocks closed out January lower despite the so called "January effect", with predictions that stocks should be more bullish in the month of January. However, it should be remembered that January effect is a 2 parter - 1st part talks about the gains in January itself, while the 2nd part says that a bullish January will result in a bullish year and vice versa. Comparing statistics, the 1st part is only true less than 2 out of 3 times (65.7%), while the 2nd part is slightly more reliable at 71% where S&P 500 is concerned.
However, this 71% does not paint a full picture. If we examine it more closely, we will notice that out of the 12 years of 35 where stock prices were bearish in January, the January Effect is only true out of 5 attempts, a mere 41.7%. This is a stark contrast to the 20/23 (87%) hit rate for the positive side of January Effect. Hence, it will be more correct to say that the year will have a high chance of ending positive if January closes bullishly, but the reverse is not true.
This is not rocket science, and anybody with 15 mins of their time and access to monthly historical data of S&P 500 will be able to make this "discovery". Hence, it is highly unlikely that traders will start selling stocks believing that 2014 will end bearishly. This is not saying that further bearish correction is not possible, but rather if prices does end up lower when we take stock in December, it is unlikely that the supposed January Effect was the reason that led to it.
On the other hand, is there any correlation between January and Feb?
Since 1950, there has been 25 years where January ended up lower, and 15 out of the 25 years February closed in the red as well. Since the index crossed the 1,000 mark, we have 5 out of 7 years where a red January led to a red Feb for an average of -40 points. For the remaining 2 years where Feb did not follow suit, the average gain was only +26 points. Hence, if traders want to simply follow the numbers, betting on a Feb decline has a higher hit rate compared to betting that we will end lower in December.
There is some valid reasoning for this phenomenal as well which trend traders will attest to: Momentum. It is more likely that Feb will end lower because bearish momentum in January has given bears a head start in Feb. However, it should be noted that there isn't a lot of data points to make the numbers statistically significant. Certainly we can go back further in time, but that would be when S&P 500 is in triple digits, and double digits in some cases, which makes comparison hard as the situation back then is entirely different. As such, traders should use the numbers provided here with a huge pinch of salt and not bet the whole house on this as what we are seeing could simply be non-statistically significant variations (e.g. the mean could still be 50%).
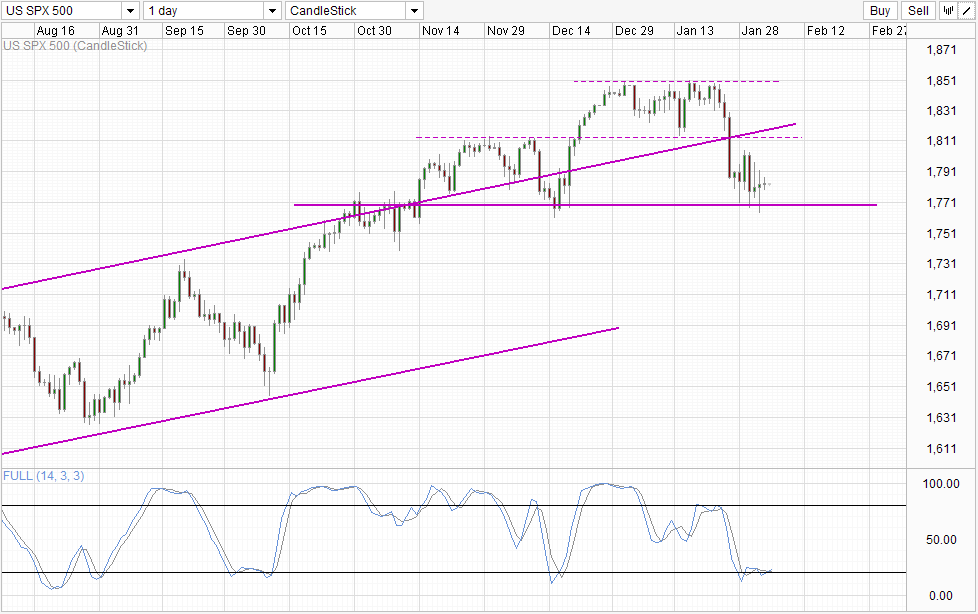
Daily Chart

From a a Technical Analysis perspective, the holding of 1,770 continues to give hope to the bulls as the bullish momentum appears to be intact. Similarly, Stochastic readings are pushing above 20.0, giving us a bullish cycle signal. This opens up the potential for price to test 1,812.5 once again, and potentially all the way towards 1,850 if Channel Top is broken. Should 1,770 breaks (likely if the January/Feb bearish relationship holds), we could see strong bearish continuation as the bullish momentum will be heavily impaired. Given that US stocks holders are borrowing a record level of funds in order to hold their current positions, any significant bearish move or a sign of break in bullish momentum will likely result in strong sell-off follow-through as these leveraged buyers are not able to withstand larger declines.
