
The S&P opened well below Tuesday's close and fell continuously all day, ending with a 1.82% loss, its largest loss since September 9. The turmoil surrounding the Trump administration in Washington has reverberated through the markets.
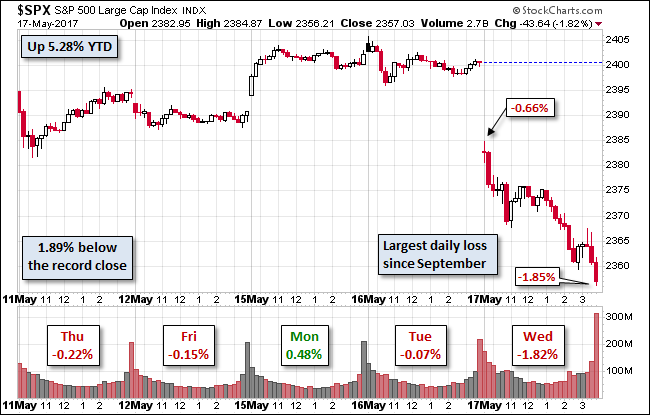
The U.S. Treasury puts the closing yield on the 10-year note at 2.22%.
Here is a daily chart of the S&P 500. Wednesday's selling puts the volume 10% below its 50-day moving average.

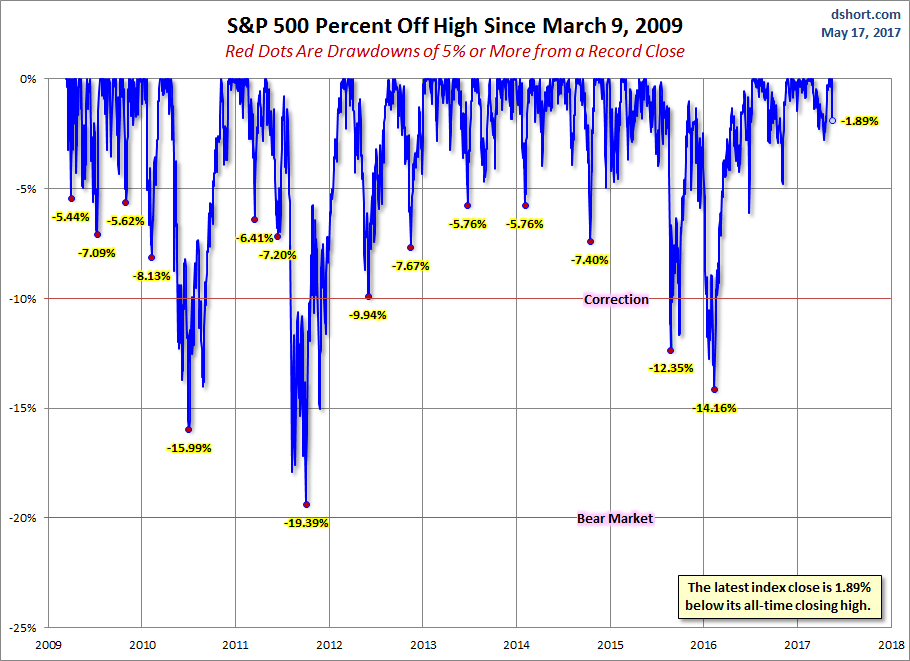
A Perspective on Drawdowns
Here's a snapshot of record highs and selloffs since the 2009 trough.
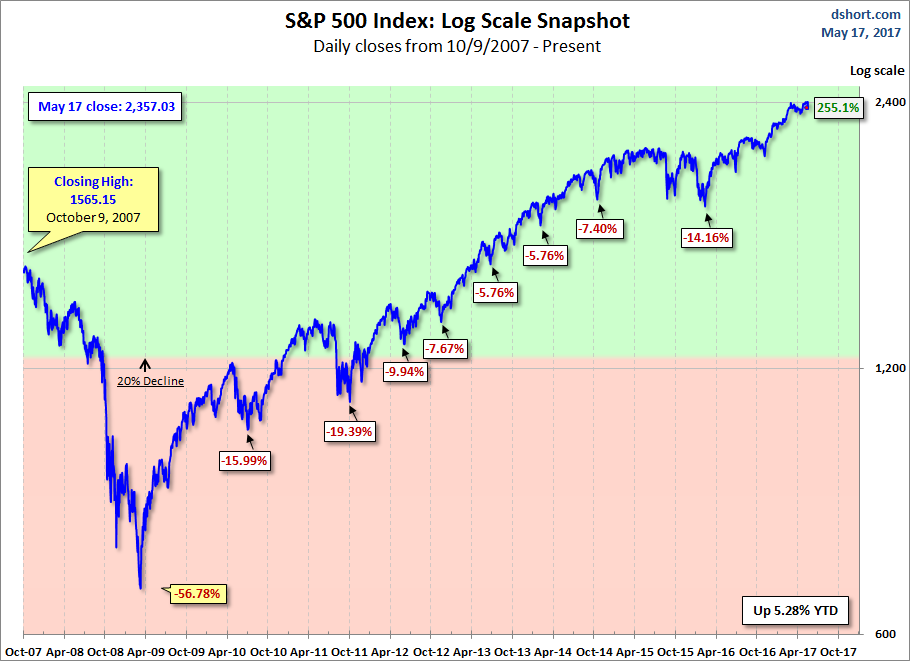
Here is a more conventional log-scale chart with drawdowns highlighted.
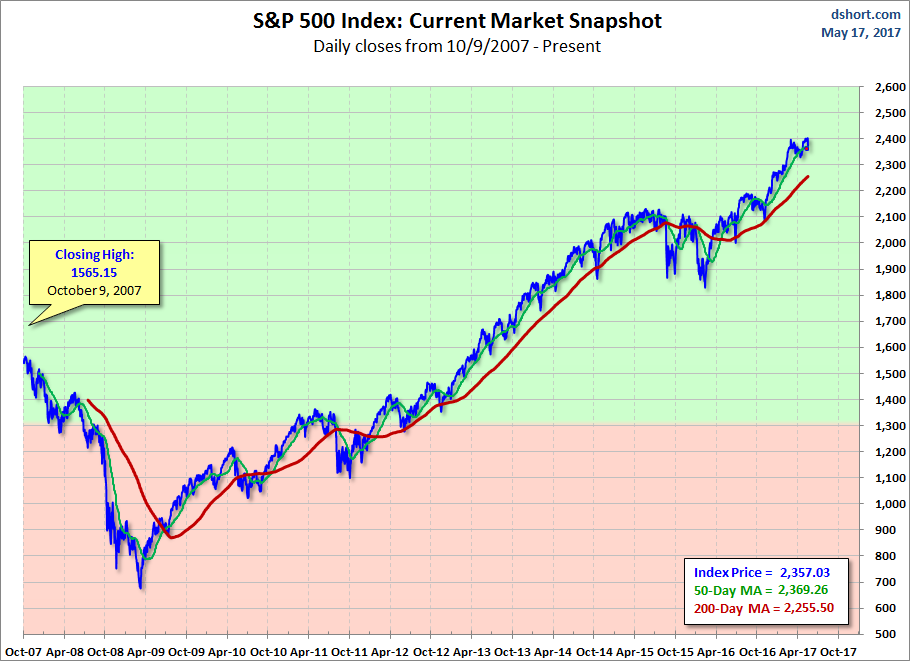
Here is a linear scale version of the same chart with the 50- and 200-day moving averages.
A Perspective on Volatility
For a sense of the correlation between the closing price and intraday volatility, the chart below overlays the S&P 500 since 2007 with the intraday price range. We've also included a 20-day moving average to help identify trends in volatility.
