CONSOLIDATION
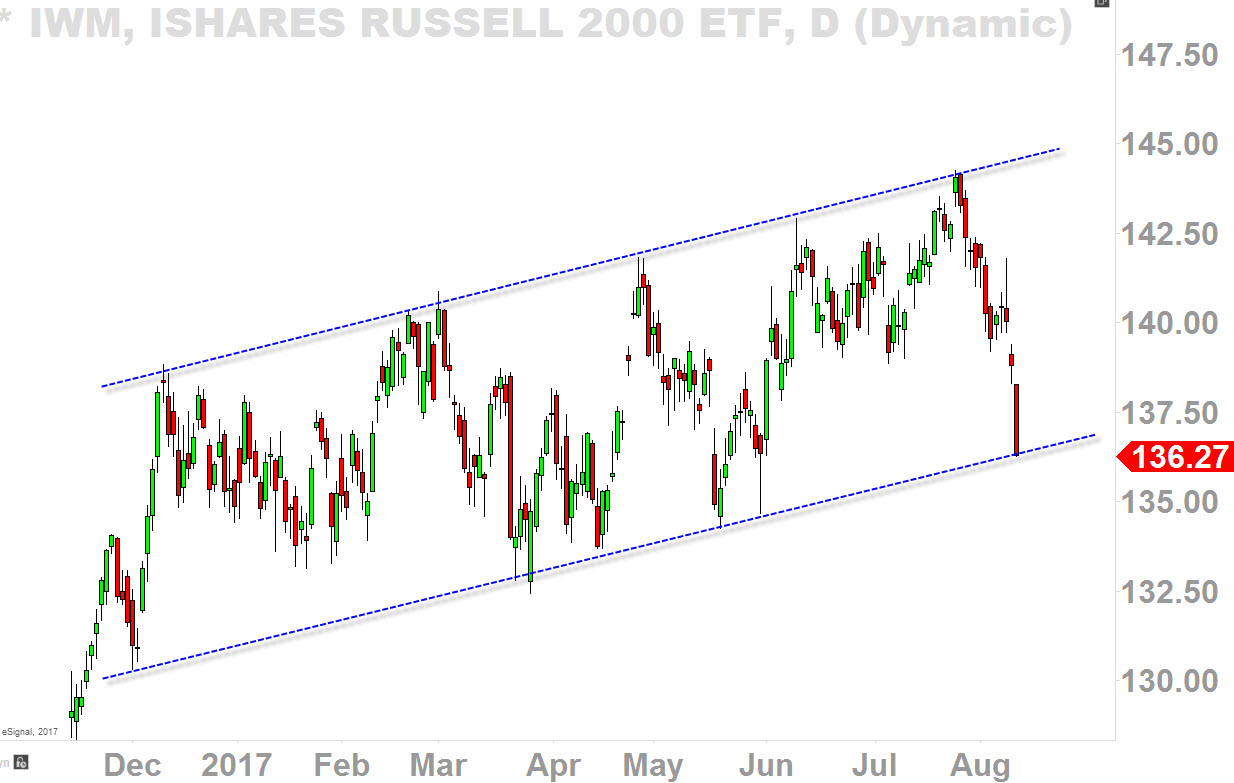
Once again, this 8-month channel resistance prevails as the sellers rush in.
Last few weeks of the selling pressure has been much more aggressive compare to January, March or May.
Because it has been a panic selling as the traders rushed in to catch that epic breakout to the upside in late July, instead, we are met with the panic sell off to the downside - oh, how I love this market, it not a market without these fake outs!
As far as the sentiment is concerned, this straight down-move's audacity is vulnerable, because straight down-move can be recovered quickly with straight up-move (remember the trend gets established with series of lows and highs).
Currently we are back at the bottom of this channel which has been served as strong support for 8 months.
This is where you may see many head-fakes where the price could get slightly below this rising channel-support before reversing right back up, so I wouldn't be so quick to trying to short this here as it came from 144ish to 136ish within just over 2 weeks.

200SMA
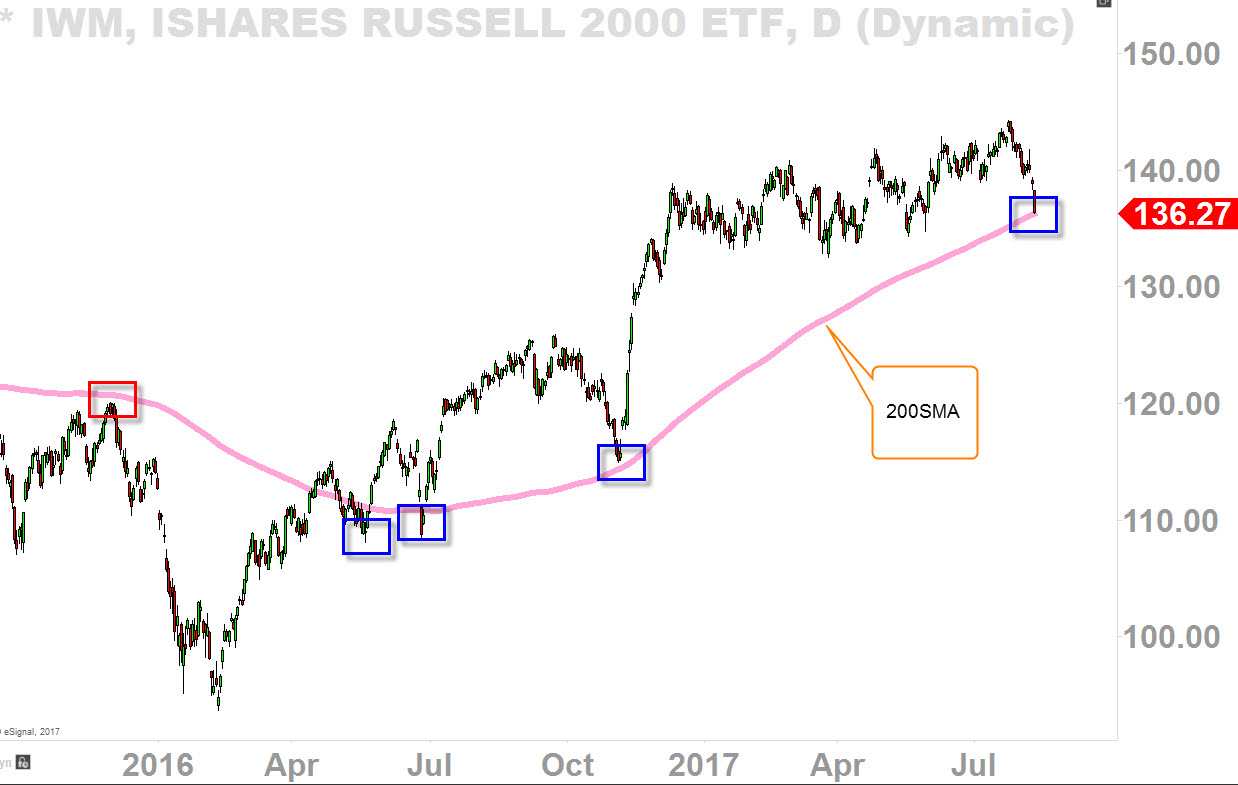
IWM is the only index (except the Transport) that is touching "200SMA."
SPY (NYSE:SPY), DIA, PowerShares QQQ Trust Series 1 (NASDAQ:QQQ), and VanEck Vectors Semiconductor (NYSE:SMH) is no where near 200SMA. This means Russell 2000 truly corrected through time - 8 months to be exact.
What this means is, you look for opportunity here on IWM and the small-caps when others are fearful. T
his is why I bought more CALLS at 136.72 earlier today adding to my already holding positions
on iShares Russell 2000 (NYSE:IWM) (see my IWM journalposts).
OSCILLATOR
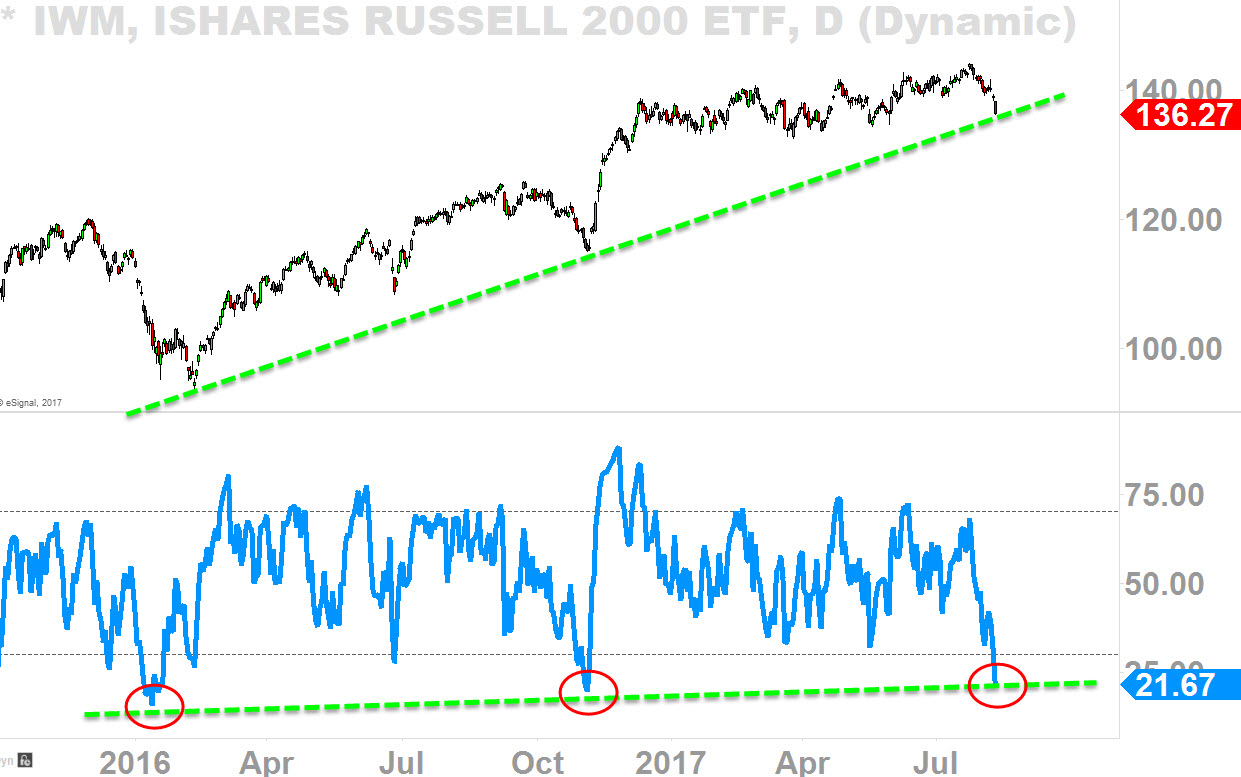
My RSI oscillator has not been in this level since the early 2016 and late 2016 (see red circles).
Interesting to note that, June 2015 through January 2016 IWM has seen a 7-month bear market declining more than 27% before RSI reached it's extreme oversold condition.
November 2016 with election jitters we did see pretty sharp decline, and today, here we are as the RSI is showing similar sentiment as those two events even though IWM's performance is flat if we track it since December of 2016 where this consolidation began.
It took 8-month for IWM to finally reached out to this rising uptrend-support where we are trading right on it today.
Again, this is the level you may see many head-fakes as the price could get slightly below it and reverses right back up.
Why? Because we are still in a primary-term uptrend.
IWM is not in a bear market like it was in late 2015, it is still bullish in the primary-term perspective as I still believe that it is possible for IWM can make about 20% run from here until early next year.


