by Diane Freeman
Every other week we've been asking a selection of our contributors for their opinion on what we believe are some of the most pressing market-focused questions of the week. This time we wondered:
Have the FAANGs come to the end of their bullish run or is there still life in the tech sector? How are you allocating for that going forward?
- FAANGs remain attractive but valuations have gotten stretched and growth looks more questionable
- There's more value in other tech stocks, AI one sector to watch moving forward
- Facebook the weakest of the bunch on technicals and fundamental news
- Netflix enjoying a great year but has weak technical undercurrent
Charles Sizemore
The FAANGs trade is a little long in the tooth at this point, and, frankly, no trade lasts forever. Apple (NASDAQ:AAPL), Amazon (NASDAQ:AMZN), and Alphabet (NASDAQ:GOOG) were all within striking distance of trillion-dollar market capitalizations, and Facebook (NASDAQ:FB) was on pace to get there pretty quickly at the rate its share price was appreciating. There is still a lot of like about this group. All are leaders in their respective corners and all but Netflix (NASDAQ:NFLX) and Amazon have extremely fat margins and large cash cushions.
But in the race to $1 trillion, valuations have gotten stretched, and growth looks more questionable. Social media is no longer new (a third of the world's population is already a regular Facebook user) and Facebook's business model is now under regulatory scrutiny. Smartphones are a saturated market, and Apple's business model depends heavily on squeezing more revenue out of a base that is no longer growing. Netflix faces new competition from former partners, such as Walt Disney Company (NYSE:DIS). Alphabet is still essentially a one-trick pony that depends far too heavily on advertising revenues from its search engine. Amazon is attracting unwanted political attention, and any or all of these companies could be the subject of antitrust action by the U.S. or European Union.
These are all strong companies and it makes sense to keep them on a watch list. But I'm not a buyer at current prices and this late in the cycle. The better trade today is in beaten-down value sectors. I particular like midstream energy and auto stocks at current prices.
Jeff Miller
My approach separates the two parts of your question. I like tech in general, but see the FAANG run as over-extended. Those who love emphasizing the high-flying leaders may keep the run going by changing the membership. They have already added an “A” to the original lineup, and may be about to lose a consonant. Vanna can’t help with that one.
It is important to have comfort with the current overall prices of stocks. For value investors like us, we also want to own stocks that trade at a multiple close to or below their current PEG ratio. With occasional exceptions, the FAANG stocks have not qualified. The entire group is challenging for the value approach. Apple qualified for a time, but is now fully valued. Amazon is OK if you find some value criterion other than earnings. Google (NASDAQ:GOOGL) might qualify, depending on your assumptions. Facebook is now at value prices if the company can navigate the current crisis. There are no real bargains.
When there is selling in this group, such as that sparked by Facebook’s data revelations, it rapidly spreads from one ETF to another. These large-cap names are sold, generating arbitrage versus ETFs and leading to the decline of all members.
This provides an opportunity in tech stocks that are not closely linked to these names and their stories. Artificial intelligence will be a big technology driver. The path will not always be smooth, but we can’t even imagine the possibilities. Read a magazine from 2008 and compare the tech stories then to what we see now. Or go back to 2000.
Tech stocks, especially semiconductor stocks, are cheap because many Wall Street analysts are playing amateur economist. They are using their personal conclusions about the business cycle to predict changes in what they see as a cyclical sector. This is mistaken on many levels.
The result? There is plenty of cheap tech, and I am taking advantage of the opportunity. Lam Research (NASDAQ:LRCX) is especially attractive, but don’t watch the daily swings!
In a few years we may get a new acronym with names from AI stocks. And by the way, you could also make an argument similar to this for a collection of biotech stocks.
Declan Fallon
It has been a rocky start to 2018 with direct and indirect Trump factors; for example, Cambridge Analytica (+ fake news distribution), Trump vs Jeff Bezos and a new tariff war, hitting certain FAANG stocks, with the contagion spreading to those indirectly impacted and the broader Tech sector. But not-to-long ago, the same Trump factors were driving the post-election rally; ‘Business Man’ leader, accelerated deregulation with industry friendly appointments, funding cuts to regulatory agencies and massive tax cuts favoring the investment classes.
In reality, the “Trump factor” is a bit of a red herring; it’s the uncertainty and randomness of what may come – be it Trump, terrorists or natural disaster - rather than what has come that’s the problem. With that in mind, we can only consider how markets value FAANG component stocks here-and-now.
The last nine years have been a breeze for bulls barring a few slip-ups. It’s easy to talk “strong fundamentals” when prices are ticking slowly higher on the back of low volatility; fundamental analysis has its greatest ally when market volatility is low. But when things get heated and billions are getting wiped off stocks in days, if not hours, then fundamentals offer little comfort if in a few days your stock position is down 10, 15 or 20%.
This leaves us with looking at how current price action relates to what has gone in the past. With that in mind, how has this played out for FAANGs? Facebook is the stock most in trouble.
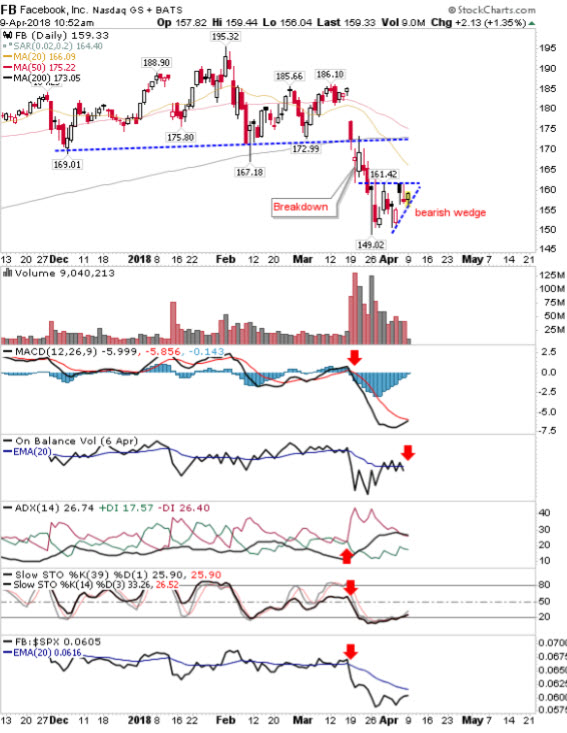
Before the Cambridge Analytica story broke, the stock had been treading water since December 2017. Converged 20-day and 50-day MAs signaled a stock lacking a trend, supporting technicals had drifted, with stochastics turning strongly bearish at the start of February as subsequent rallies later that month and during early March (prior to the Cambridge Analytica data breach news) failed to recover the mid-line cut off between bullish and bearish conditions.
Coincidentally, the timing of the data breach came with the undercut of the 200-day MA – a key long term support level. Since then, the stock has been coiling into what looks like a ‘bearish wedge’ and if this proves true then look to a break of angled support and a potential measured move down to $125s.
If there is to be a bullish outcome then there needs to be a substantial buying volume break of $161 but even if it does this, then it will find itself running into supply at the 50-day MA ($175) and the former support level – now resistance - of the pre-Cambridge Analytics trading range, doubling the significance of the $175 price level.
Next up is Trump’s best friend, Jeff Bezos’ Amazon. The personal animus has stung Amazon but hasn’t yet challenged the long term trend.
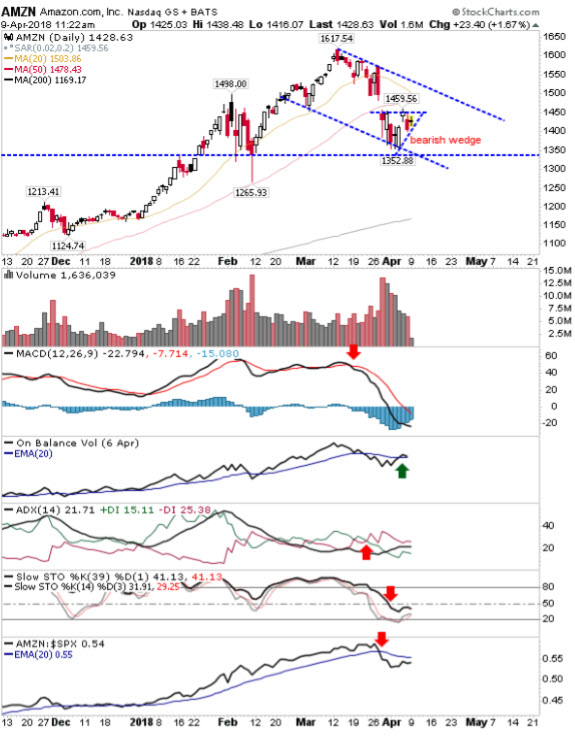
The stock remains well above its 200-day MA at $1169 although like Facebook there is a ‘bearish wedge’ shaping up, but it’s not as damaging in that it remains inside a consolidation channel (the March price channel), it’s above the February swing low and On-Balance-Volume has actually switched back in favor of accumulation.
While it’s not as weak as Facebook I could see profit takers pushing it down into a test of its 200-day MA so it’s not one to rush into with both feet.
Apple exhibited ‘barely a scratch’ from the year’s events. The stock is rangebound but action of the last couple of weeks has done little to hurt the stock.
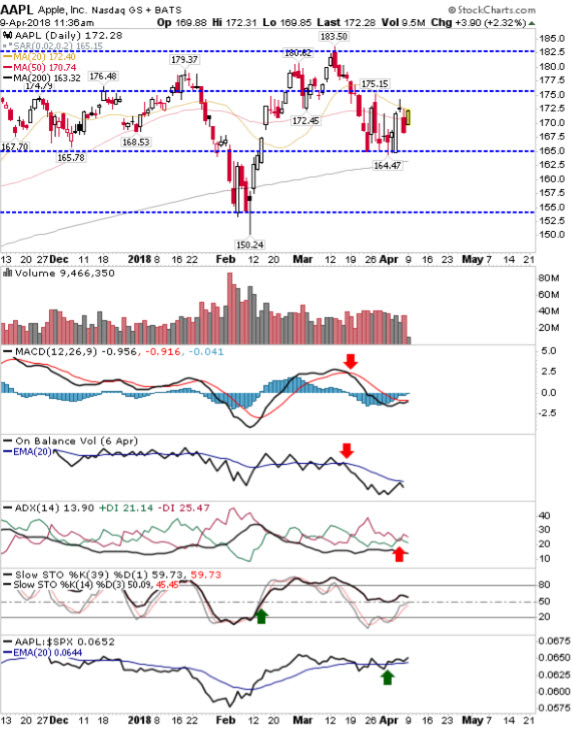
Technicals are mixed but stochastics has maintained a bullish stance since mid-February and the stock is again out-performing the S&P. The concern is the stealth selling as marked by On-Balance-Volume and the proximity of the 200-day MA.
While stocks trading near or at their 200-day MA are often viewed as a good time to ‘buy’, if there is a breach of the 200-day MA on the back of current volume selling then I would be looking at a running wound which could quickly fester. Taking some money off the table so you can say you sold Apple at $170s might look wise six months down the road but don’t get rid of it as this isn’t a company going away anytime soon.
Alphabet is interesting by being non-interesting.
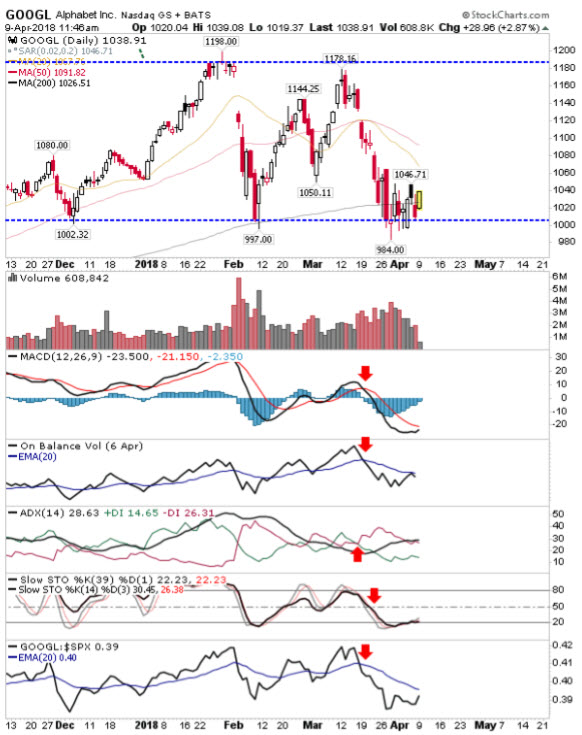
While Apple has major and minor horizontal support and resistance levels, Alphabet has just major support and major resistance and major support is psychological $1000, which is close to the 200-day MA and is around where current price action is loitering.
Offering perhaps the best buying opportunity of the five stocks it does this on the back of relative underperformance against the S&P and net bearish technicals (all on ‘sell’ triggers). A loss of $980 might be a cause for panic selling but if there is a stock which is going to benefit from an oversold bounce, Alphabet is well placed to be it.
Finally, there is Netflix, the stock has had a stellar year, trading around its 50-day MA and still 40%(!) above its 200-day MA.
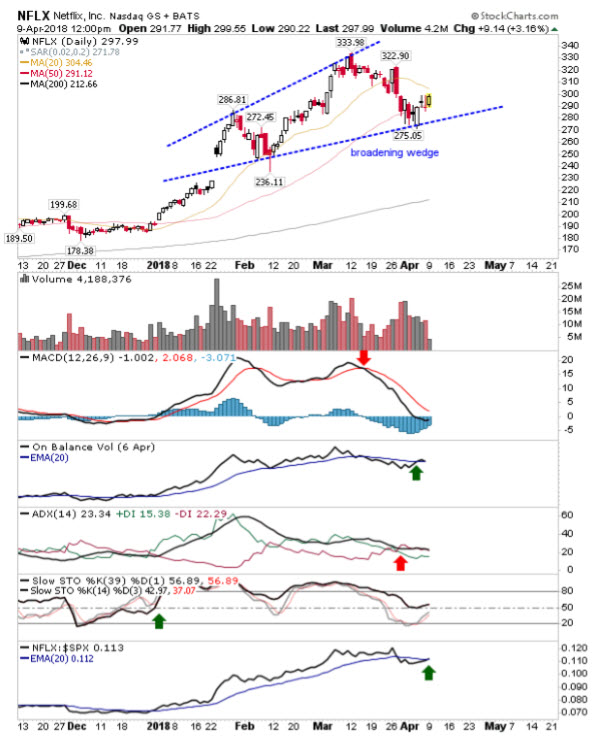
Short-term buyers look like they may get the most joy here but there is a technical undercurrent of weakness which would make me reluctant to commit on a longer time frame; I reckon better value opportunities will present themselves later in the year.
Having said that, the only real trouble is the sharp degradation in the MACD; a loss of $275 would open up for a net bearish turn in technicals with the bullish stochastic in place since December 2017 likely to be swung in favor of bears. As of April’s action, stochastics has managed a picture-perfect test of support but the rally off the 50-day MA needs to continue into a challenge of $322 for it to put some distance from this mid-line support and give it some wiggle room on the next decline. Of the five, it’s a Hold with profit taking kicking in on a loss of $275 or its 50-day MA depending on your stress levels.
Personally, I’m not looking to buy anything until I see the S&P trading 10% below its 200-day MA and/or the NASDAQ 15% below its 200-day MA. I don’t hold any positions at this time, FAANG or otherwise bar global equities and water utility ETFs in my pension.
