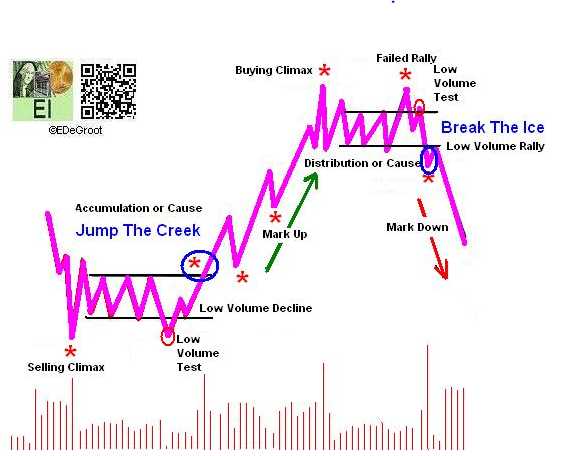
US Treasury bonds (ARCA:TLT), confined to cause building since 2012, jumped the creek of resistance at 129.60. This breakout, the trigger that likely convinces the bagholders of the bond bubble to buy without reference to risk, came at a point when the public, through negative interest rates, began paying governments (history's serial defaulters) to hold their money.
This show of (misplaced) confidence will dissipate under a backdrop of panic when budgets implode under the combined weight of rising doubt (failing confidence) and cyclical contraction. Interest rates will rise defy expectations by rising. Rising rates means confidence and greed will transition to doubt and fear with alarming speed.
Doubt will drive the wolf pack to culling the herd of sovereign debt. The pack will prey on the weak first, but will turn to more formidable adversaries as time passes. It will not relent until the strong have been culled. This process will sow the seeds of the next global technological and economic expansion.
The professional investors must profit by anticipating future trends and events rather than chasing old news. This is done by following the invisible hand or message of the market. That message, the simultaneous study of the the cycle of accumulation and distribution (trend), the distribution, movement, and participation of leverage (leverage), time/cycles, and human behavior that excludes opinions is defined below:
Trend
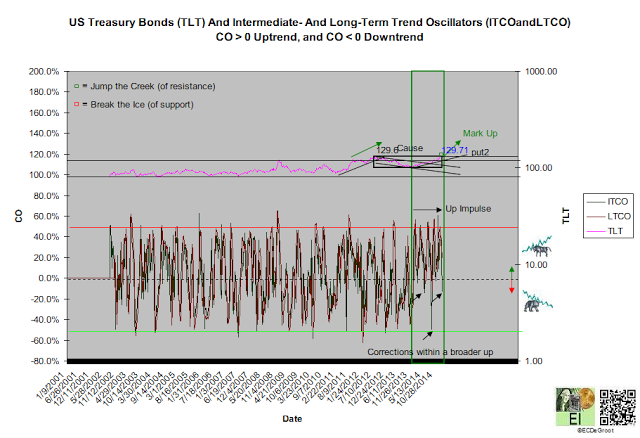
US Treasury Bonds' trend oscillators¹ generated a bullish crossover in January 2014 (chart 1). This triggered an up impulse that jumped the creek at 129.69 in early January 2015 to transition the trend from cause to mark up. This breakout is now being tested as support. If previous resistance is successfully tested as support, it favors continuation of mark up. This outcome will be influence by whether or not the invisible hand accumulates or distributes the decline (see leverage)
Continuation of mark up could lead to extreme concentration and upside capitulation. This type of rally only delays the wolf pack's attack. Smart money, recognizing that the wolves will wait until the the prey is weak and vulnerable (when nobody fears bonds), remains patient.
Chart 1
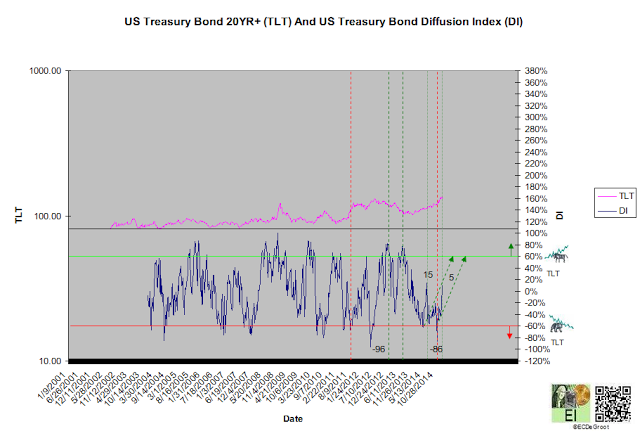
Leverage Bond's DI reading of 5%, an slight downtick from as price decreased suggests distribution² (chart 2). This distribution, confined within a positive DI, defines a growing bullish bias within an aging bears phase³. Significant distribution in May and November 2014, a series of bullish setups known as clusters, likely defines a market trying to complete a bearish oscillation.
DI has already risen sharply as price declined from 134 to 129. Continuation of this trend as the breakout zone from cause is tested favors continuation of mark up.
Chart 2
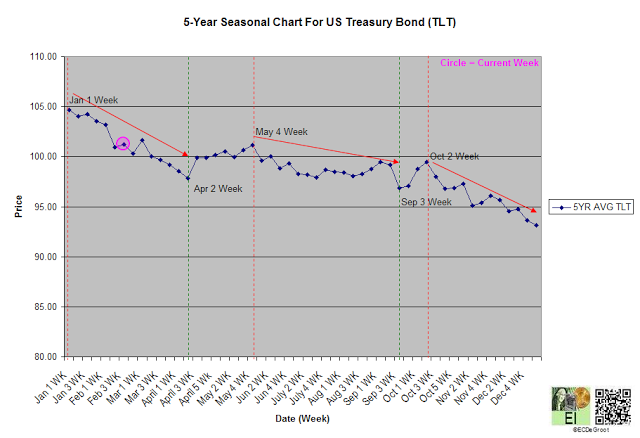
Time/Cycles The 5-year seasonal cycle defines a downward path of least resistance until early April (chart 3). This is confirmed by the long-term cycles.
Seasonal cycles define tendencies. While price generally follows them, it can move independently during periods of extreme stress. Stress often generates 'unexpected' rallies or declines. Today's growing debt stress across periphery economies have been generated unexpected outcomes for months. Deviations from the norm will only get worse as stress turns to crisis.
Chart 3
The intermediate-term close oscillator (ITCO) and long-term close oscillator (LTCO) define a market's trend oscillators and impulse wave. For example, when both trend oscillators are positive and negative, they define up and down impulse waves, respectively. Mix readings, such as a positive ITCO and a negative LTCO, suggest a market transitioning up to down, and vice versa.
The relationship between DI and price defines accumulation and distribution. Positive (direct) and negative (inverse) relationships as price rallies indicate accumulation and distribution accumulation, respectively. Positive (direct) and negative (inverse) relationships as price declines indicate distribution and accumulation, respectively. In general, bulls purchase accumulation and sell and/or reduce risk into distribution. Bears sell distribution and/or reduce risk into accumulation.
Bull and bear phases are defined as positive to negative and negative to positive diffusion index (DI) oscillations. reduce risk into distribution. Bears sell distribution and/or reduce risk into accumulation.
Bull and bear phases are defined as positive to negative and negative to positive diffusion index (DI) oscillations.


