
RenaissanceRe Holdings Ltd. (NYSE:RNR) delivered fourth-quarter 2018 operating earnings per share of 2 cents, comparing favorably with the Zacks Consensus Estimate of operating loss of $1.93 per share. The result was backed by superior underwriting, higher revenues and application of gross-to-net strategy. However, the bottom line declined substantially by 98% year over year.
The quarter under review witnessed many catastrophic events.
Quarterly Operational Update
RenaissanceRe’s fourth-quarter operating revenues of $633 million surpassed the Zacks Consensus Estimate by 16%. The top line also improved 27.4% year over year, driven by higher net premiums earned.
RenaissanceRe Holdings Ltd. Price, Consensus and EPS Surprise
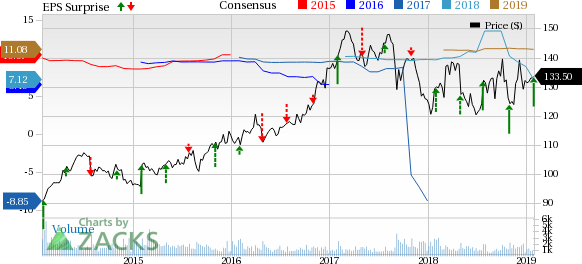
RenaissanceRe Holdings Ltd. Price, Consensus and EPS Surprise | RenaissanceRe Holdings Ltd. Quote
Gross premiums written surged 34.3% year over year to $547 million owing to higher premiums in the Property as well as the Casualty and Specialty segments.
Net investment income came in at $53 million, down 27.4% year over year due to losses on private equity and catastrophe bond investments. However, this downside was partially offset by higher returns on its fixed maturity and short-term investment portfolios.
RenaissanceRe’s total expenses were $680.8 million, up 52% year over year, primarily on higher net claims and claim expenses, acquisition expenses and operational expenses.
Underwriting loss of $82.3 million was wider than the year-ago quarter’s loss of $10.4 million.
Combined ratio was 114.3% for the fourth quarter compared with the year-ago quarter’s tally of 102.5%.
Quarterly Segment Update
Property Segment
Gross premiums written were $199.9 million up 110.1% % year over year, led by higher premiums written in catastrophe class of business.
Underwriting loss of $35 million due to Hurricane Michael, California Wildfires and changes in the 2018 Aggregate losses was wider than the year-ago quarter’s underwriting loss of $22.7 million. Combined ratio of 110.6% is flat with the year-ago quarter’s metric.
Casualty and Specialty Segment
Gross premiums written were $347.8 million, up 11.3% from the prior-year quarter. This upside is driven by continued and selective growth from new business opportunities within a few classes of business.
The company incurred underwriting loss of $47.4 million against the year-ago quarter’s income of $11.5 million.
Combined ratio of 119.3% expanded 2480 basis points year over year.
Financial Position
As of Dec 31, 2018, total assets of RenaissanceRe were $18.7 billion, up 23% from 2017-end level.
The company had total debt of $991 million as of Dec 31 2018, up 0.1% from the level at 2017 end.
Cash and cash equivalents were $1107 million, down 18.7% from the tally at 2017 end.
Book value per share of $104.1 rose 4.4% year over year.
Return on equity for the quarter under review is 0.1%.
Full-Year Highlights
Revenues for the year dipped 1.4% to $2.1 billion. The company delivered net income of $4.91 per share versus the prior year's net loss of $6.15.
Zacks Rank
RenaissanceRe carries a Zacks Rank #3 (Hold).
Performance of Other Insurers
Of the insurance industry players that have reported fourth-quarter earnings so far, The Travelers Companies, Inc. (NYSE:TRV) and RLI Corp.’s (NYSE:RLI) earnings beat the respective Zacks Consensus Estimate while the metric of The Progressive Corporation (NYSE:PGR) missed the same. You can see the complete list of today’s Zacks #1 Rank (Strong Buy) stocks here.
Zacks' Top 10 Stocks for 2019
In addition to the stocks discussed above, wouldn't you like to know about our 10 finest buy-and-holds for the year?
From more than 4,000 companies covered by the Zacks Rank, these 10 were picked by a process that consistently beats the market. Even during 2018 while the market dropped -5.2%, our Top 10s were up well into double-digits. And during bullish 2012 – 2017, they soared far above the market's +126.3%, reaching +181.9%.
This year, the portfolio features a player that thrives on volatility, an AI comer, and a dynamic tech company that helps doctors deliver better patient outcomes at lower costs.
See Stocks Today >>
The Progressive Corporation (PGR): Free Stock Analysis Report
RenaissanceRe Holdings Ltd. (RNR): Free Stock Analysis Report
RLI Corp. (RLI): Get Free Report
The Travelers Companies, Inc. (TRV): Free Stock Analysis Report
Original post
Zacks Investment Research