
Reinsurance Group of America, Incorporated (NYSE:RGA) reported first-quarter 2019 adjusted operating income of $2.61 per share, which missed the Zacks Consensus Estimate of $2.68 by 2.6%. Net foreign currency fluctuations had an adverse impact of 11 cents on the bottom line. However, the bottom line improved 62.1% from the year-ago quarter’s figure.
The company witnessed strong momentum in terms of organic growth and in-force transactions. The company continued to benefit from earnings diversity that comes with having a global operating platform. Strong results in Asia and Canada offset some modest weakness in other regions.
Reinsurance Group's operating revenues of $3.4 billion improved 10.1% year over year. Moreover, the top line beat the Zacks Consensus Estimate by 4.7%.
Net premiums of $2.7 billion rose 6% year over year. Investment income increased 12.3% from the prior-year quarter to $579.9 million on asset growth. Average investment yield improved 3 basis points to 4.49%.
Total benefits and expenses at Reinsurance Group increased 5.5% year over year to $3.2 billion. Higher interest expense and operating costs resulted in cost escalation.
Reinsurance Group of America, Incorporated Price, Consensus and EPS Surprise
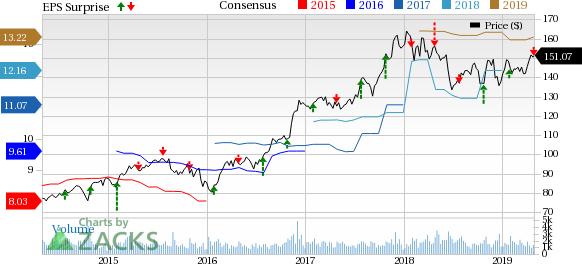
Reinsurance Group of America, Incorporated Price, Consensus and EPS Surprise | Reinsurance Group of America, Incorporated Quote
Quarterly Segment Update
U.S. and Latin America: Total pre-tax income increased 35.2% to $96 million in the quarter under discussion.
The Traditional segment reported pre-tax adjusted operating income of $18.1 million, a significant increase from $1.2 million in the year-ago quarter. Net premiums rose 4% from the year-ago quarter to $1.4 billion owing to higher sales volume.
Asset Intensive segment’s pre-tax adjusted operating income improved 19.9% to $59.6 million. Financial Reinsurance business reported pre-tax adjusted operating income of $18.3 million, which decreased 9.4% year over year.
Canada: Total pre-tax income climbed 59.9% to $46.8 million.
Traditional segment’s pre-tax adjusted operating income surged 74.2% to $44.6 million on the back of favorable individual mortality experience. However, forex had an adverse effect of $2.4 million on the metric. Net premiums increased slightly to $255.3 million. However, net foreign currency fluctuations had a negative effect of $12.7 million.
Financial Solutions segment’s pre-tax adjusted operating income slumped 59.3% year over year to $1.3 million attributable to slightly unfavorable longevity experience while net foreign currency volatility had an adverse effect of $0.1 million.
Europe, Middle East and Africa (EMEA): Total pre-tax income of $50.5 million declined 1.5% from the prior-year quarter’s figure.
Pre-tax adjusted operating income of the traditional segment was $15.4 million, flat year over year. Net foreign currency fluctuations had a negative impact of $1.7 million. Premiums declined 3.1% year over year to $363.9 million. Foreign currency exchange rates had an adverse effect of $32.6 million on the metric.
The Financial Solutions segment delivered pre-tax adjusted operating income of $35.1 million, down 2.2% from the year-ago quarter and matched expectations. However, net foreign currency fluctuations had an adverse impact of $2.6 million on the metric.
Asia/Pacific: Total pre-tax income of nearly $40 million increased 65.4% from the prior-year quarter.
Traditional segment’s pre-tax adjusted operating income of about 36.6 million improved 59.8% from the year-ago period on favorable overall experience in Asia, partially offset by a loss in Australia. Net foreign currency fluctuations adversely impacted the result by $2.2 million. Premiums increased 10% to $646.7 million, reflecting continued growth in Asia, offset by a reduction in Australia. The results witnessed an unfavorable forex impact of $27.2 million.
The Financial Solutions segment’s pre-tax adjusted operating income surged 153.8% to $3.3 million owing to better-than-expected results from a treaty that is in runoff as well as new treaties effective this quarter.
Corporate and Other: Pre-tax adjusted operating loss was $19.8 million against income of $30.9 million in the prior-year period.
Financial Update
As of Mar 31, 2019, Reinsurance Group had assets worth $66.7 billion, up 6.8% from the level at 2018 end.
As of Mar 31, 2019, Reinsurance Group’s book value per share excluding accumulated other comprehensive income, grew 7.6% year over year to $126.38
Adjusted return on equity was 11%.
The company exited the quarter with $0.9 billion in excess capital.
Share Repurchase and Dividend Update
Reinsurance Group deployed capital of $100 million into in-force and other transactions and share buybacks.
In the quarter under review, the company bought back shares worth $50 million.
The board of directors cleared a dividend of 60 cents per share, payable on May 6, 2019 to shareholders of record as of May 9, 2019.
Zacks Rank
Reinsurance Group currently carries a Zacks Rank #2 (Buy). You can see the complete list of today’s Zacks #1Rank (Strong Buy) stocks here.
Performance of Other Insurers
Among other players from the insurance industry that have reported first-quarter earnings so far, the bottom line of Torchmark Corporation (NYSE:TMK) , MGIC Investment Corporation (NYSE:MTG) and The Travelers Companies, Inc. (NYSE:TRV) beat the respective Zacks Consensus Estimate.
Is Your Investment Advisor Fumbling Your Financial Future?
See how you can more effectively safeguard your retirement with a new Special Report, “4 Warning Signs Your Investment Advisor Might Be Sabotaging Your Financial Future.”
Click to get it free >>
Torchmark Corporation (TMK): Free Stock Analysis Report
Reinsurance Group of America, Incorporated (RGA): Free Stock Analysis Report
MGIC Investment Corporation (MTG): Free Stock Analysis Report
The Travelers Companies, Inc. (TRV): Free Stock Analysis Report
Original post
Zacks Investment Research