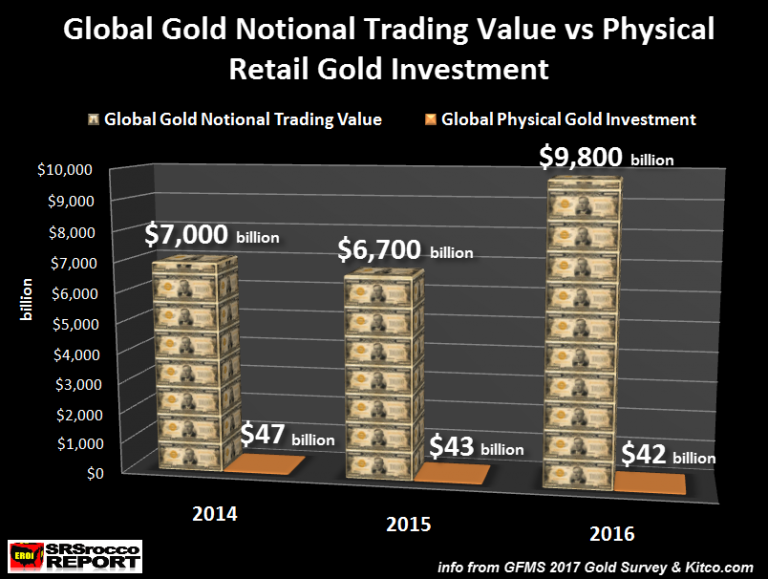
How do you depress the physical gold price? It’s quite easy… you throw $10 trillion paper dollars at it. Not only did global paper gold trading amount reach a new record in 2016, it surpassed the previous year’s total by nearly 50%.
This is simply amazing when we look around at the staggering amount of insanity taking place in the financial markets. With the economic and financial markets sitting at the edge of the cliff, it would seem prudent for investors to curtail their highly leverage bets in the “Paper Gold Casino” and buckle down by purchasing real physical metal.
Unfortunately, the Mainstream media and the Financial networks have totally lobotomized investors by removing the following vocabulary from the mushy substance between their ears….. Wisdom, Prudent, Long-term, Safe-haven and Gold-Silver.
With the advent of twitter, wisdom today comes down to reading no more than ONE SENTENCE. Anything longer than that is a complete waste of time when it is better spent sitting in front of six computer monitors trading digits. Forget about investing one’s money to build up a real company, when it is more stimulating to try and SCALP tiny profits by trading stocks all day fueled by a half dozen monster energy drinks.
This is called progress…… a giant leap forward for mankind and technology.
Global Gold Exchange Notional Trading Amount Hit New $10 Trillion Record In 2016
According to GFMS newly released 2017 Gold Survey, total global exchange notional trading amount reached $9.8 trillion in 2016. This was up 46% from $6.7 trillion in 2015. These figures were based on the total amount of “volume in nominal tonne equivalent” traded on nine exchanges. For example, here are the top four exchanges annual gold traded quoted by GFMS:
- COMEX = 179,047 tonnes
- SHFE = 34,760 tonnes
- SGE = 11,793 tonnes
- TOCOM = 8,541 tonnes
The total amount of paper gold traded on the nine exchanges in 2016 equaled 243,000 metric tons versus 180,000 metric tons the previous year. I took these values and multiplied them by the average annual gold price to arrive at the figures below. I also compared these figures to the total amount of physical gold retail investment for each year (source GFMS 2017 Gold Survey):

As we can see, the global exchanges traded a stunning $9.8 trillion worth of paper gold last year versus $42 billion in physical gold investment. This turns out to be 233 times the amount of paper gold traded for each ounce of physical gold purchased.
With this sort of trading volume, the Monster Beverage 1990 Corp (NASDAQ:MNST) looks like an excellent investment opportunity. And why shouldn’t it be? The Monster Energy Drink stock price has surged nearly 10 times from $5 in 2009 to $46 currently. While this may seem like a good stock to invest in, I am waiting until they sell Monster Energy IV’s that you just stick in your arm so you can continue trading without wasting waste time knocking down 5-6 individual cans.
We must remember… TIME IS MONEY.
So, the question is this…. what would happen to the physical gold market if a small percentage of the Monster Energy Drink traders purchased physical gold instead of the millions of contracts traded on the exchanges. According to GFMS, total gold trading volume just on the COMEX last year was a stunning 58 million contracts.
Annual Global Gold Exchange Trading Volume Also Reached New Record Of 7.8 Billion Oz
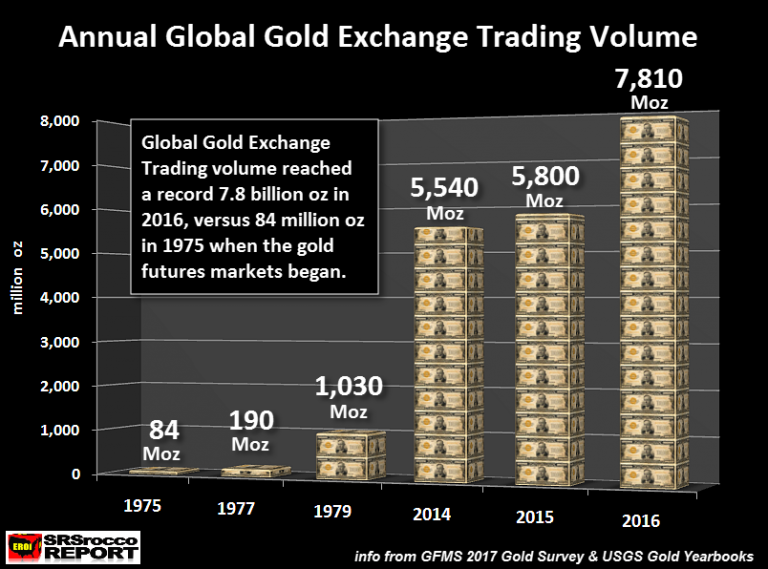
Furthermore, if we look at the total amount of paper gold traded on the nine exchanges in 2016, it also reached a new record 7.8 billion oz:

Not only was the 2016 total 7.8 billion oz paper gold trading volume 34% higher than in 2015, it was 76 times higher than the 103 million oz of world gold mine supply. I decided to add the paper gold trading volume during the 1970’s when the gold futures markets began. During the first year of gold futures trading in 1975, a total of 84 million oz (Moz) were traded. However, by the end of the decade and as the gold price shot up towards $850, total paper gold trading surpassed one billion oz in 1979.
Again, what would have been the reaction to the physical gold market if investors purchased more physical gold in 1979, than the one billion ounces of paper contracts?? Well, I will tell you what I think from some wisdom from Jim Rickards. I listened to Jim Rickards interview with Greg Hunter today and he had some very interesting things to say. One of Rickards interesting tidbits was that Americans own about one ounce of gold each versus the typical poor Indian farmer who has acquired kilos of gold.
