Because the dollar has such an important bearing on everything, especially the precious metals, it is timely for us to take a close look at it here after its recent steep drop, for as some of you may have seen, a number of indicators pertaining to the dollar suggest that, possibly after some further downside it is likely to bounce, or at least take a rest in a sideways range for a while, before the decline perhaps resumes in earnest.
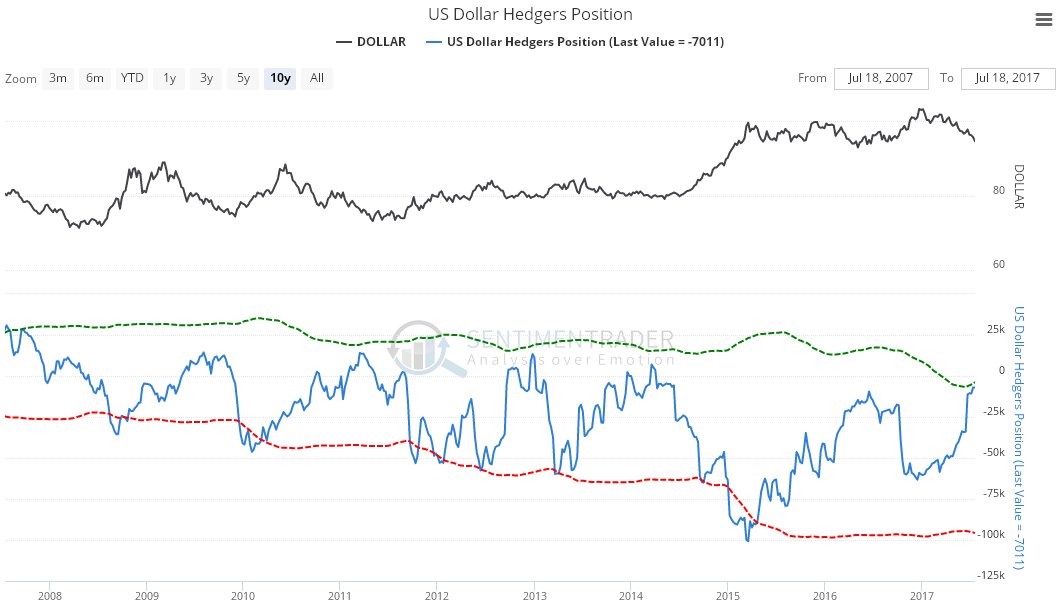
We’ll start by looking at a couple of these indicators. The latest US dollar Hedgers chart, which is a form of COT chart, is certainly starting to look bullish, and until these positions ease somewhat, further significant downside for the dollar in the short-term looks unlikely.
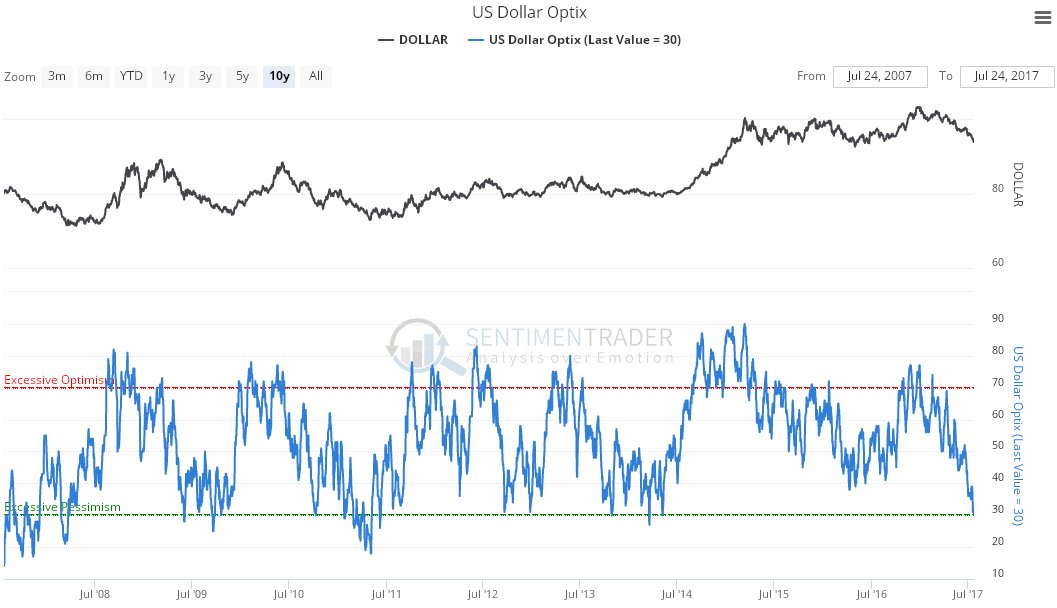
Meanwhile the latest Dollar Optix, or optimism chart, also shows that pessimism is getting overdone. This doesn’t necessarily mean that the dollar’s downtrend is done, however, as minor rallies can cause this to ease before it then plumbs new lows. These two indicators taken together suggest that a relief rally is likely in the dollar soon, perhaps after it drops a bit lower first, although they don’t mean that the rally will get very far.
Alright, so how does this square with our stated super bullish position on the precious metals, gold and silver ?
Well, it doesn’t, of course, since a dollar rally normally means that gold and silver will drop back. So what’s going on here?
The latest COTs for gold and silver were super bullish, especially silver, which was even more bullish than late 2015, and the key point to make here is that they remain so, regardless of any other considerations or what is going on elsewhere. This being so it means one of two things – either the dollar and gold and silver are going to rally in unison, unlikely but possible, or after some kind of relief rally or consolidation pattern, the dollar’s decline will resume, perhaps with a vengeance, and as we will see it could possibly accelerate into a crash.
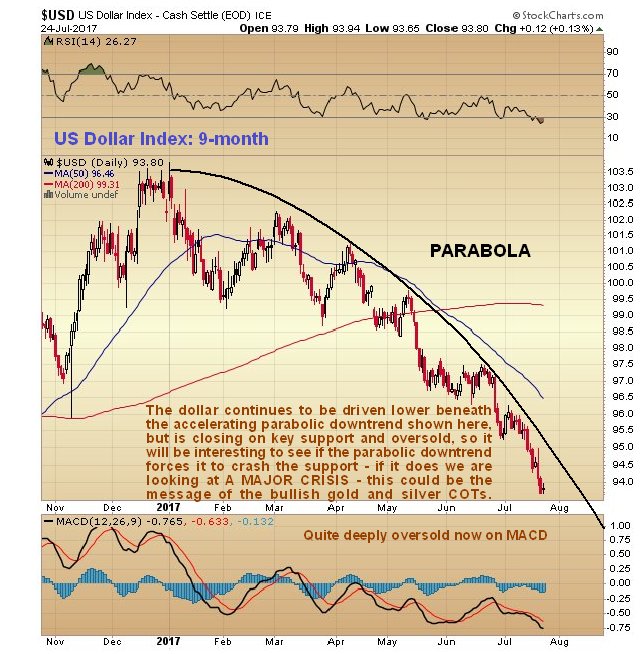
Turning now to the charts for the dollar itself, we start by looking at its latest 9-month chart. As we had already figured out a month or two ago, it is being forced lower at an accelerating pace by a parabolic downtrend. Now we are arriving at a critical juncture above key support with the key indicators above suggesting a bounce or a pause in the decline. However, should the parabola force a breakdown below the support, a really severe decline or crash will be in prospect.
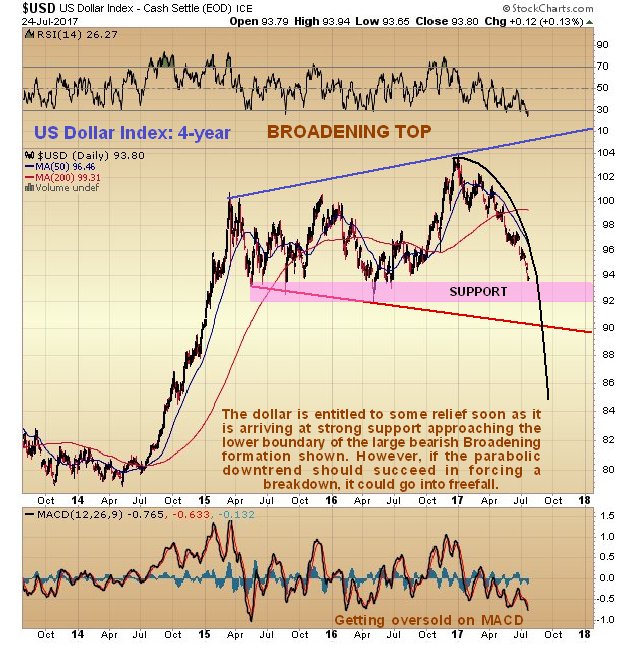
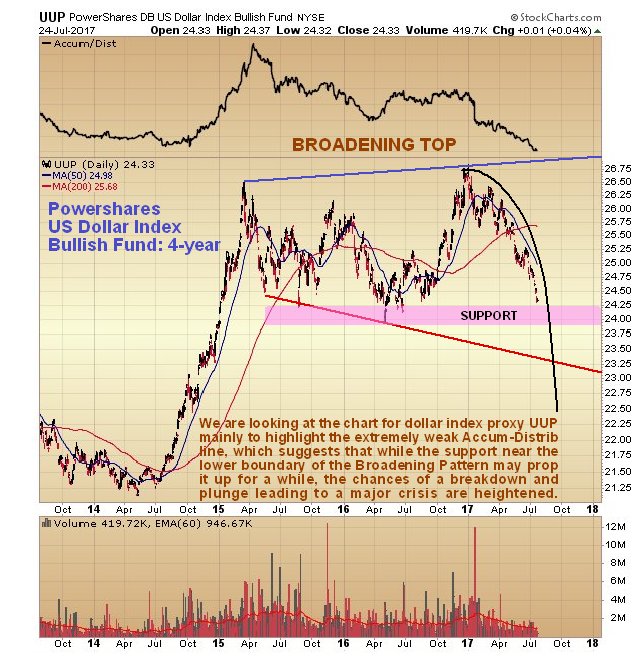
On the 4-year chart we can see how the parabolic downtrend has forced the dollar down towards the key support approaching the lower boundary of a large bearish Broadening Formation. While several indicators are suggesting that it will take at least a breather here, if it does break down the consequences for the dollar are likely to be dire – and this could be the message of the super bullish gold and silver COTs.
It’s also useful to look at the 4-year chart for dollar proxy, the PowerShares DB US Dollar Bullish (NYSE:UUP), which looks about the same as the dollar index chart, except that we can also look at volume and volume indicators. The Accum-Distrib line in particular is extremely weak, and gives us an additional clue that the dollar may be in the early stages of a really serious decline. Again, this could explain the strongly bullish gold and silver COTs.
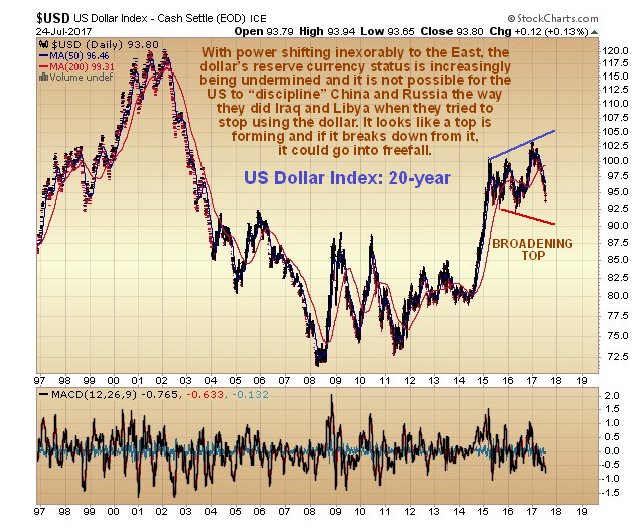
Finally, we will take a quick look at the very long-term 20-year chart for the Dollar Index. This chart makes plain that if the dollar has peaked, and is soon to enter a severe decline, it won’t be the 1st time in the past two decades, as between 2002 and 2008 it suffered a massive drop – and that was long before it was threatened with being delisted as the global reserve currency. This chart also shows that it could drop a long, long way from the bearish looking Broadening Top that may now be approaching completion.
Conclusion: the latest extremely bullish COT charts are not negated by the dollar being oversold here and some of its indicators looking positive. The bigger picture is that the dollar may be headed for a breakdown and severe decline or even a crash.
Important footnote to US subscribers: it is very important to attempt to protect your capital from a serious loss in the value of the US dollar, which looks set to occur regardless of any short-term rally to alleviate its current oversold condition. The Canadian dollar is a real standout in this respect, because Canada is partly a resource based economy and should get a big boost from the expected bullmarket in gold and silver, and other metals, which will translate into a strong Canadian dollar. The ideal solution for US subscribers, if this route is open to you, is to set yourself up to buy resource stocks on the Toronto and Venture exchanges.
