The last time we wrote about Rational (LON:0FRJ) was on February 5th. The stock had just reached an all-time high of 740 euro a share in January following a 17-year uptrend. With the price hovering around 690 at the time, new records seemed to be just a matter of time.
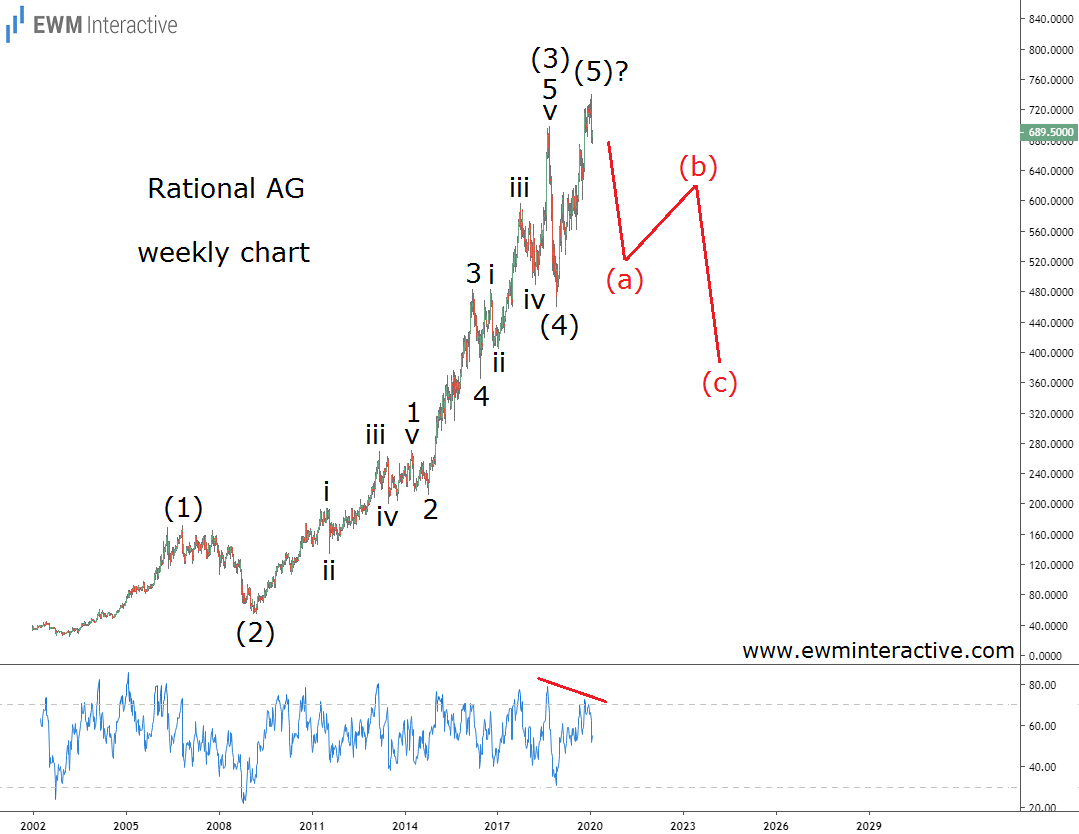
On the other hand, no trend lasts forever. Even the best of companies are not immune to market crashes. So instead of blindly trusting the bulls, we decided to take a look at that 17-year uptrend from an Elliott Wave point of view. Our efforts resulted in the chart below, published 50 days ago.

Rational’s weekly chart revealed a textbook five-wave impulse from the bottom at 25.32 in March 2003. The pattern was labeled (1)-(2)-(3)-(4)-(5), where wave (3) was so extended that two lower degrees of the trend were visible in its structure.
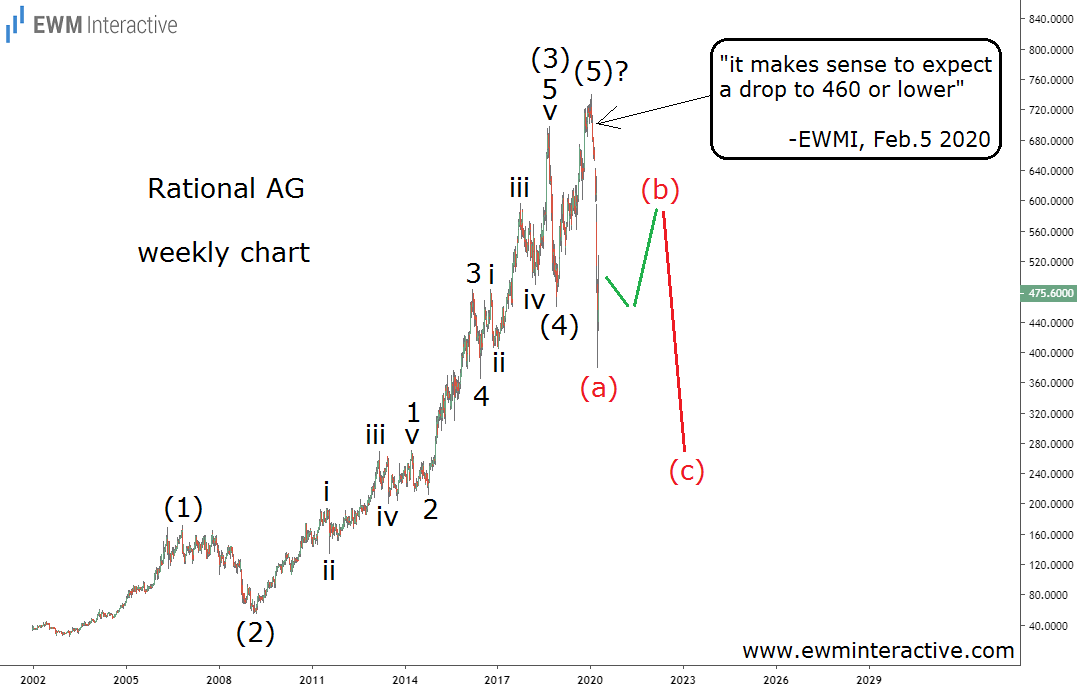
According to the theory, a three-wave correction follows every impulse. If this count was correct, it made “sense to expect a drop to 460 or lower.” In addition, there was a strong bearish RSI divergence between waves (3) and (5). In early-February, it appeared Rational stock’s long-lasting uptrend was finally coming to an end. The updated chart below shows what happened next.

In a much more violent manner than we ever thought possible, Rational crashed to 377 euro by March 18th. The stock lost 49% in just two months, erasing the bulls’ entire progress since June 2016. The COVID-19 outbreak that plunged all markets was totally unpredictable. Rational’s crash, however, was preceded by the most well-known pattern in the Elliott Wave catalog.
Is Rational Stock a Good Deal Now?
The stock is currently trading near 475, still down ~36% from its all-time high. The company’s revenue grew 8% in 2019, while net income increased 9%. Does this make Rational a good buy now? In our opinion, it is too early for that.
Rational’s earnings per share reached 15.09 euro last year. With the stock at 475, this gives us a price-to-earnings ratio of 31.5. That is still too pricey for a company whose growth rate is in the single digits. Not to mention the fact that a big chunk of Rational’s client base – restaurants, schools, universities, catering operations and more – are now closed because of the virus.
And last, but not least, corrections are supposed to consists of three waves. The selloff to 377 cut Rational’s market cap in half, but it is still just a single wave. If the analysis above is correct, waves (b) up and (c) down should complete the 5-3 cycle, before the uptrend can resume. It looks like the bears are not done with Rational stock yet. Targets below 300 are plausible once wave (c) begins.
