
Q3'17 Earnings Season
The new earnings season is officially here with five major banks expected to report this Thursday and Friday: JP Morgan Chase (NYSE:JPM) (NYSE: JPM), Bank of America (NYSE:BAC) (NYSE: BAC), Citigroup (NYSE:C)(NYSE: C), Wells Fargo (NYSE:WFC) (NYSE: WFC) and PNC Financial (NYSE:PNC) Services (NYSE: PNC). These reports should offer insight into how the financial sector’s earnings will unfold this season since major banks represent nearly half the sectors total earnings according to Zacks Equity Research. So what should investors expect?
CNBC recently reported that we could be in for a tough earnings season with third-quarter earnings growth expected to be the worst of the year (3.8% for S&P 500 member companies). The report also highlighted that analysts expect the financial sector’s profits to actually decline by 6% this quarter. Erin Gibbs, an S&P Global portfolio manager, says that “big surprises from financial companies (this) week could have a significant impact on the overall expectations for the quarter.”
There’s a high degree of uncertainty going into this earnings season for banks as a result of declining trading revenues, the unknown economic impact of several massive hurricanes and little progress being made on U.S. tax reform. As a result, value investors looking to take a position in any of the major bank stocks reporting this week may want to focus on returns and valuation levels. Therefore, I ranked these five bank stocks using the following five metrics: return on equity, return on assets, price to book, price to earnings, and dividend yield.
Return On Equity
Return on Equity (ROE) measures a company’s profitability in relation to the book value of Shareholders’ Equity. ROE is a measure of how effectively management makes investments to generate earnings for shareholders. It is defined as follows:
ROE = Adjusted Net Income / Average Total Equity
Many analysts consider this the most important metric to focus on when investing in banks. A ROE greater than 10% is typically the threshold between long-term value creation and destruction according to this Motley Fool post.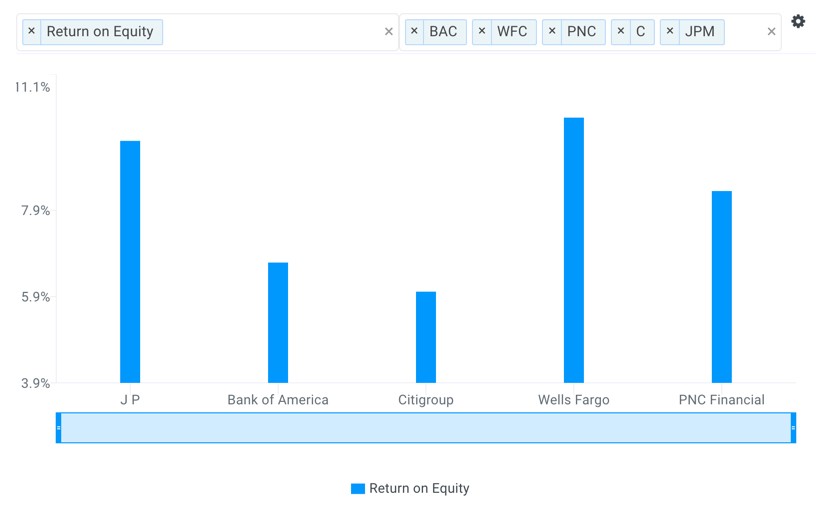
source: finbox.io
Wells Fargo and JP Morgan have the two highest shareholder returns standing at 10.1% and 9.5%, respectively. These figures are relatively higher than Bank of America’s 6.7%, Citigroup’s 6.0%, and PNC financial’s 8.4%. However, note how Wells Fargo is the only company with a ROE of at least 10%!
Return On Assets
Return on Assets (ROA) represents the dollars in earnings or net income a company generates per dollar of assets. ROA is typically used to gauge the efficiency of the company and its management at deploying capital to generate income for shareholders. It is calculated as follows:
ROA = Adjusted Net Income / Average Total Assets
All else equal, a higher return on assets suggests management is utilizing the asset base efficiently.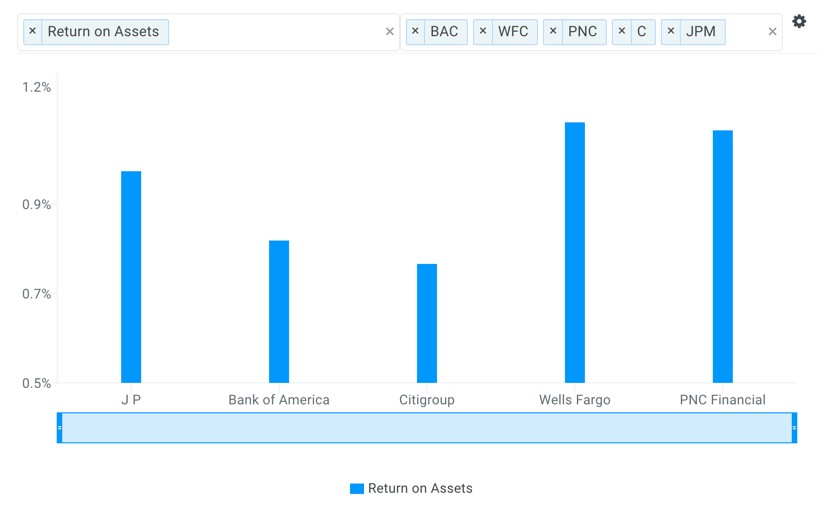
source: finbox.io
ROA is similar to ROE except that it does not reflect the impact of a bank’s leverage or debt level. Since banks are typically leveraged by a ratio of 10 to 1, a ROA of at least 1% is often needed in order to generate a ROE of at least 10%. Only Wells Fargo and PNC Financial have a ROA above 1%.
Price To Book
Analysts often look to a bank’s Price to Book Value to help determine how much to pay for a given stock. It is calculated as follows:
Price to Book = Current Stock Price / Book Value Per Share
A bank’s stock price will typically trade between 0.5x to 2.5x book value, where 1.0x book value is usually the minimum threshold with banks that enjoy a ROE of at least 10%.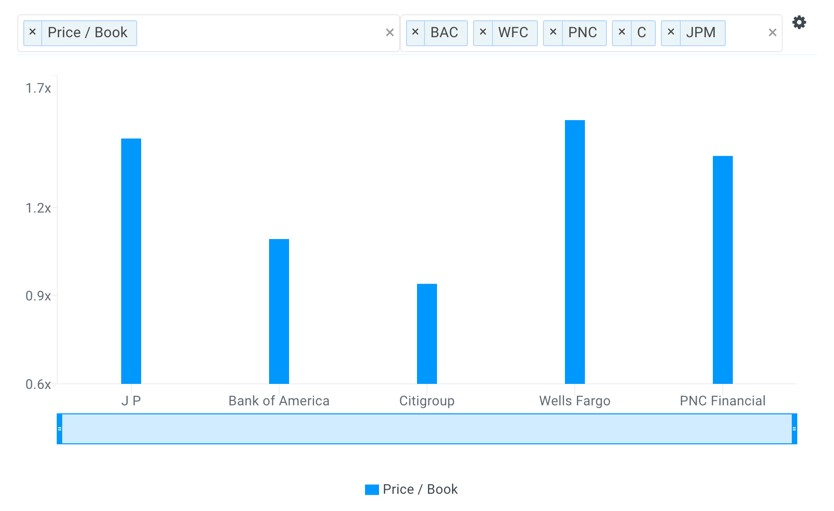
source: finbox.io
Interestingly, the five banks above all have a price to book value of 1.0x or more while only Wells Fargo has a ROE greater than 10%. This implies that these financial stock’s valuations may be getting stretched.
Price To Earnings
The price to earnings ratio or P/E multiple shows how much investors are willing to pay per dollar of earnings for a given stock. It is a better indicator of value compared to the stock price alone because it allows “an apples to apples” comparison to its peers. The ratio is calculated as follows:
P/E Ratio = Current Stock Price / Earnings Per Share
Companies with higher returns and future growth rates will typically trade at a higher P/E multiple.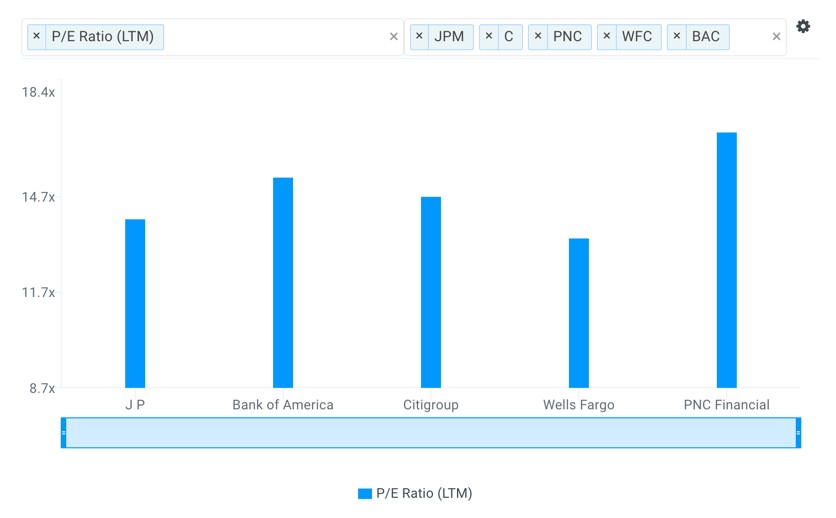
source: finbox.io
Wells Fargo’s LTM P/E multiple of 13.4x is PNC Financial’s 16.7x, Bank of America’s 15.3x, Citigroup’s 14.7x and JP Morgan’s 14.0x. However, while Wells Fargo has higher returns relative to this group, it’s important to note that Wall Street analysts expect its earnings to grow at a slower rate. This could help explain its low P/E valuation.
Dividend Yield
Dividend Yield represents cash returned to shareholders for each dollar invested. Dividend yield plus the change in stock price (capital gain) represents the total return on an investment for shareholders. It is calculated as follows:
Dividend Yield = Dividend Per Share / Stock Price
When there are no capital gains (stock price appreciation), the dividend yield is effectively the return on an investment for a shareholder. All else equal, stocks with high dividend yields are more attractive than stocks with low dividend yields. However, there are many factors to consider with dividend paying stocks which are discussed in more detail by investopedia.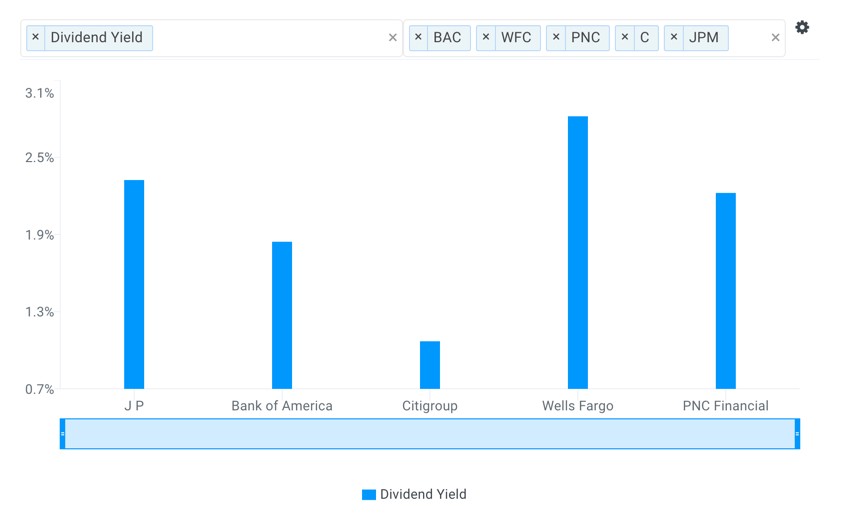
source: finbox.io
Again, Wells Fargo’s 2.8% dividend yield looks most attractive relative to Citigroup’s 1.1%, Bank of America’s 1.8%, PNC Financial’s 2.2% and JP Morgan’s 2.3%.
Wells Fargo and JP Morgan Rank the Best
The table below compares each banks performance/ratio from the five metrics mentioned above and their respective rank among the group. I then took the median rank for each stock across all five metrics to find the company with best (lowest) ranking.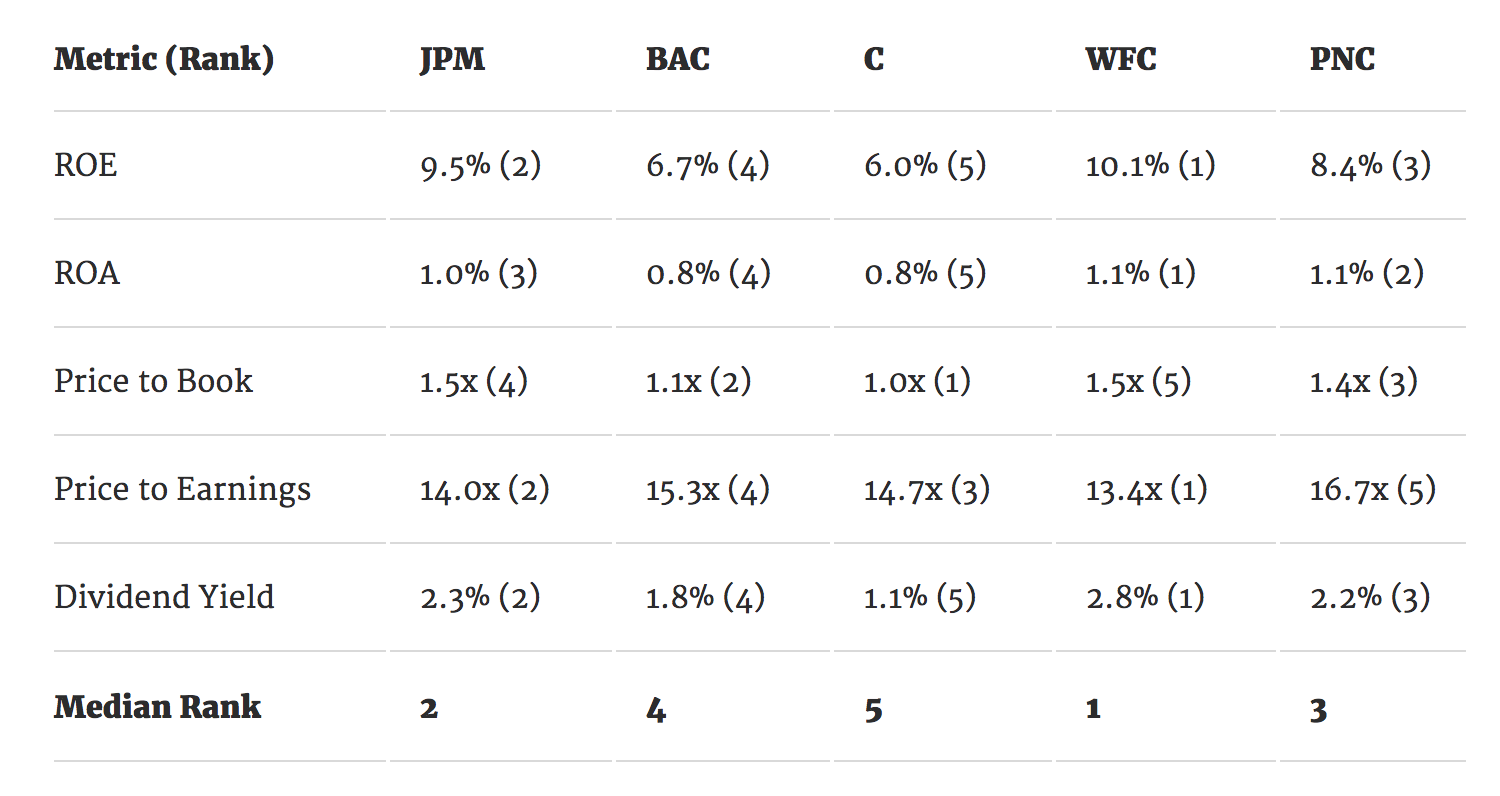
Using this approach, Wells Fargo is the clear winner as the stock with the most attractive valuation and returns. The San Francisco bank ranks number one in four out of the five categories. The only metric where Wells Fargo doesn’t look appealing is its price to book ratio which trades at 1.5x. After Wells Fargo, JP Morgan ranks 2nd, PNC Financial ranks 3rd followed by Bank of America and finally, Citigroup.
With many Wall Street analysts expecting a rough Q3'17 earnings season, investors may want to focus on returns and valuations when looking to adjust their holdings.