
The escalating trade battle between the US and China shows no sign of easing, which raises questions about the outlook for US equities. Based on year-to-date results, however, across-the-board gains continue to prevail for the major US equity factors, based on a set of exchange-traded funds.
The strongest performers – quality and liquidity factors — are essentially tied so far in 2019 through yesterday’s close (May 15). Leading the way by a hair: iShares Edge MSCI USA Quality Factor (NYSE:QUAL), which is up 16.5%. Vanguard US Liquidity Factor (NYSE:VFLQ) is trailing by two basis points. In third place: iShares S&P 500 Growth (NYSE:IVW), which is up 16.2% year to date.
Perhaps more importantly, all the major US equity factor ETFs are posting solid gains this year. The laggard, in relative terms, is Vanguard High Dividend Yield (NYSE:VYM), which is currently posting a 10.6% advance.

The bullish tailwind in the US equity market overall is certainly helping keep factor returns positive this year: SPDR S&P 500 (NYSE:SPY) is up a strong 14.6%.
The recent market volatility that’s linked to the intensifying trade conflict between Washington and Beijing increases the risk profile for stocks in this year’s second half and beyond. But the latest drop in stock prices has, so far, been mild.
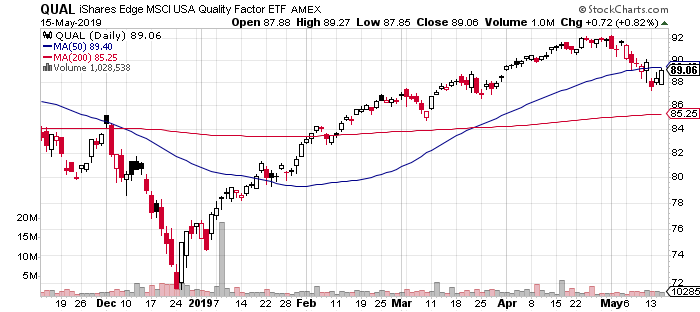
Consider, for example, this year’s factor-performance leader — iShares Edge MSCI USA Quality Factor (QUAL). The fund closed yesterday at just 3.1% below its high for the year (set on April 23).
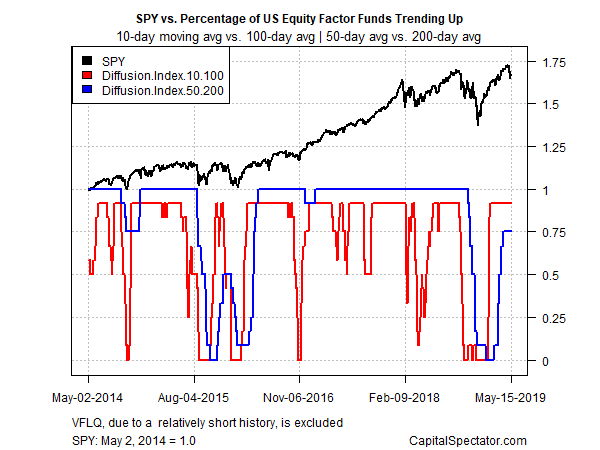
Profiling the factor ETFs based on momentum shows that most of the funds continue to enjoy a strong upside bias via two sets of moving averages. The first definition compares the 10-day moving with the 100-day average, a measure of short-term trending behavior (red line in chart below). A second set of moving averages (50 and 200 days) offers an intermediate measure of the trend (blue line). The indexes range from 0 (all funds trending down) to 1.0 (all funds trending up). Based on this data through yesterday’s close, bullish momentum still dominates.
The critical question is whether geopolitical uncertainty vis-à-vis trade-war risk will spoil the party? The latest news suggests that things could get worse before they get better, based on President Trump’s decision on Wednesday to ban US firms from using telecom gear built by China’s Huawei. The stricter rules threaten to raise tensions further between the world’s two largest economies.
“The Trump administration action is a grave escalation with China,” advise Eurasia Group analysts in a research note. The restriction threatens to “put at risk both the company itself and the networks of Huawei customers around the world, as the firm would be unable to upgrade software and conduct routine maintenance and hardware replacement.”