A good bit has happened over the last couple of weeks. The S&P 500 staged a sharp recovery from February closing lows due to repeated Central Bank actions during the month as well as an expected reflex rally fueled by short-covering. On a short term basis, the technical backdrop has improved markedly, but was it enough to change the longer-term trend of the markets from bearish back to bullish. This is the topic we will directly tackle this week.
While allocations have been very conservative since last May, avoiding the ensuing volatile declines last summer and the start of this year, I have repeatedly stated that interventions by Central Banks could nullify the “bear case” in the short-term.
Let’s start with a short-term (daily) view and update the previous observations.
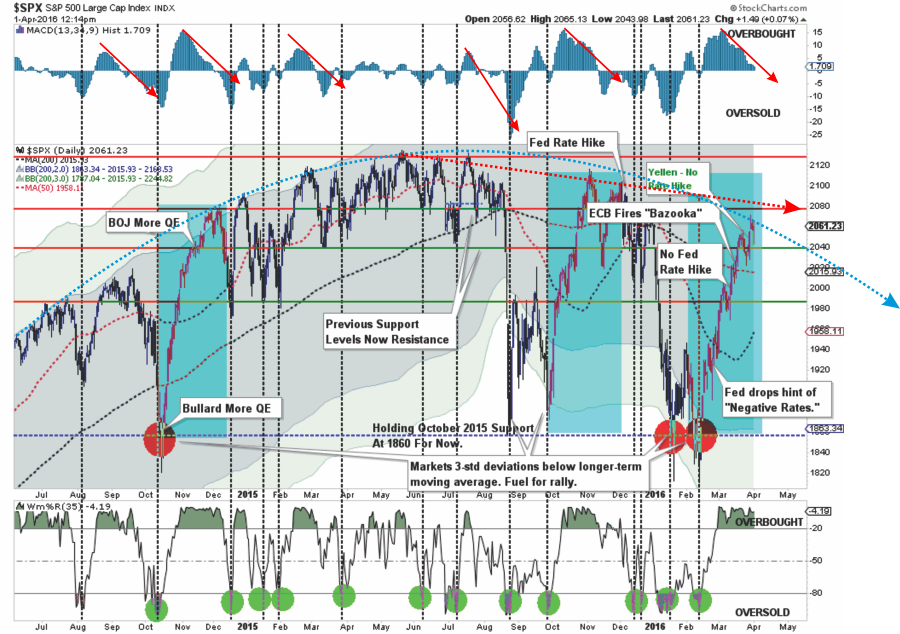
I have added some notations for the flurry of Central Bank activity that has occurred recently to push the markets higher.
1. The shaded areas represent 2 and 3-standard deviations of price movement from the 125-day moving average. I am using a longer-term moving average here to represent more extreme price extensions of the index. The last 4-times prices were 3-standard deviations below the moving average, the subsequent rallies were very sharp as short positions were forced to cover. This was the same action that we saw during the current rally.
2. The top and bottom of the chart show the overbought/sold conditions of the market. The recent rally has responded as expected from recent oversold conditions. With the oversold condition now exhausted, the potential for further upside has been greatly reduced. I have notated with red arrows that when this overbought condition reverses it has marked the end of the previous rally going back to 2014.
3. The red dashed line shows the current descending trend lines that continue to provide resistance to the advance. While the recent advance is now challenging that downtrend line, the collision of resistance levels may prove a challenge to a further advance from current levels. The arching dashed blue line shows the change of overall advancing to now declining price trends.
A Potential “Buy” Signal Approaches
By the time “buy” and “sell” signals are triggered, the initial recovery has already completed most of its initial move. This is completely expected. Importantly, if the markets are indeed reversing course, the entry back into the markets will still be very early into the next overall advance.
The importance of waiting for confirmation of a change in market dynamics, even for shorter term traders, is to establish a higher reward-to-risk ratio when putting investment capital to work. This methodology, while you will not “buy the bottom” or “sell the top,” reduces the probability of speculating incorrectly and then becoming emotionally trapped into a position that becomes detrimental to portfolio performance.
In the chart below, you will note that the previous rallies which took the markets to very overbought short-term conditions (top part of the chart). However, those rallies did not reverse the sell-signal in the lower part of the chart. Each of these previous rallies subsequently failed taking stocks lower. This is why the allocation model remained exposed to lower levels of equity risk during this entire period.
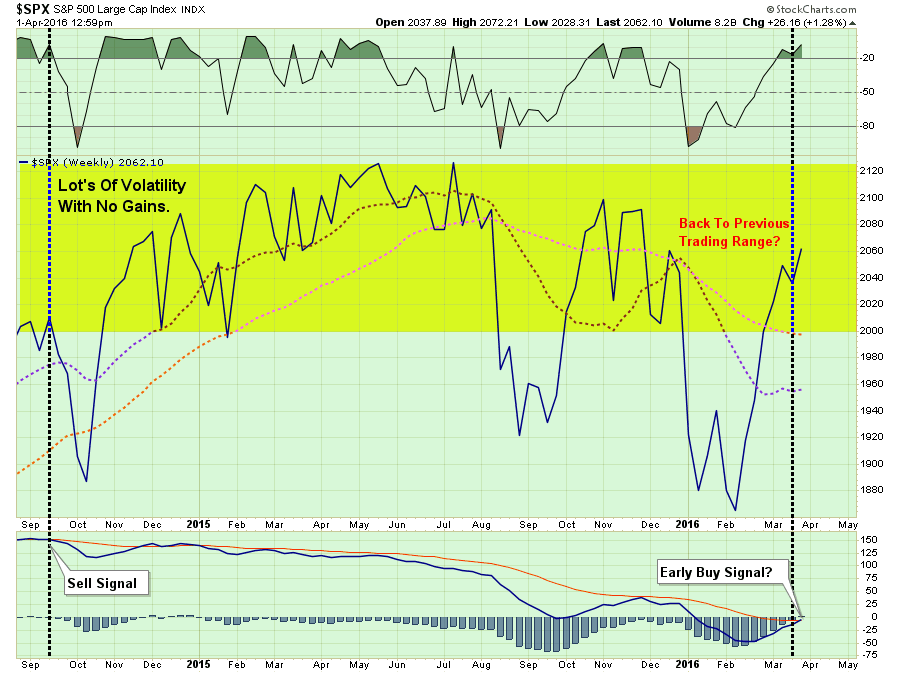
Currently, as shown above, the short-term dynamics of the market have improved sufficiently enough to trigger an early “buy” signal. This suggests a moderate increase in equity exposure is warranted given a proper opportunity. However, to ensure that the current advance is not a “head-fake,” as repeated seen previously, the market will need to reduce the current overbought condition without violating near-term support levels OR reversing the current buy signal.
Again, let me reiterate, the commentary above is for shorter-term, active investors, looking for a set up to take on equity risk. There is currently a HIGH PROBABILITY that the analysis above will be reversed in very short-order.
As a portfolio manager for individuals retirement assets, where risk must be substantially mitigated, there has been NO improvement in the intermediate technicals of the market currently.
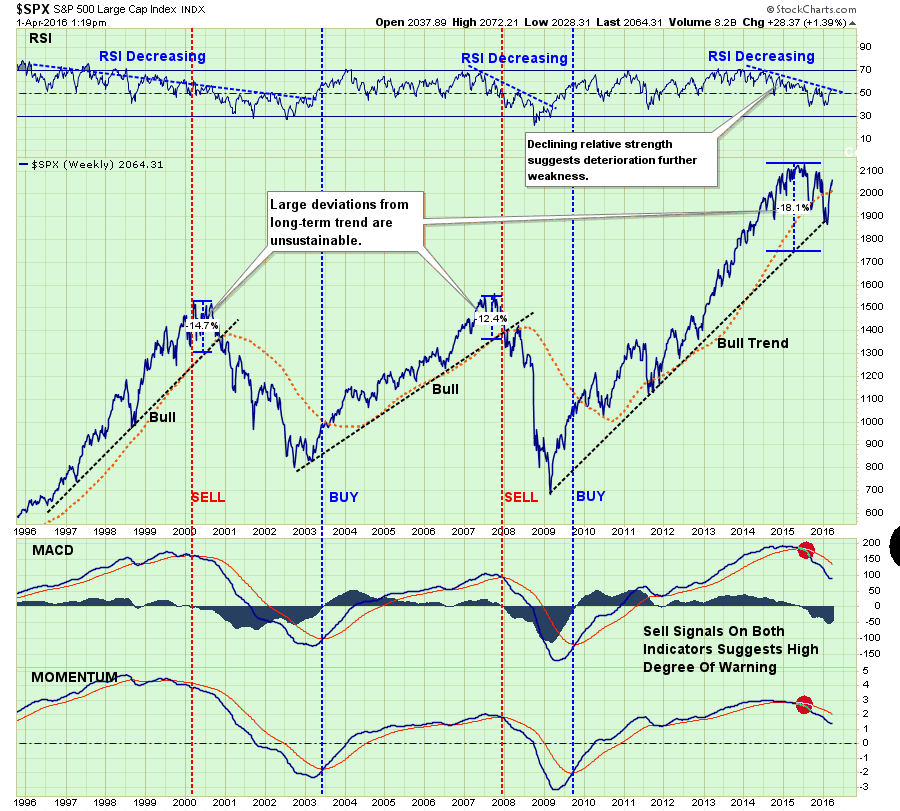
With relative strength, momentum and price deterioration still on the decline, there is currently little reason to become aggressively exposed to market risk. This is particularly the case given the extreme technical similarities to previous major market peaks.
Furthermore, if the “bulls” have indeed returned to the market, as is being suggested by the mainstream media, we should see longer term measures of market momentum and relative strength turning more positive as well.
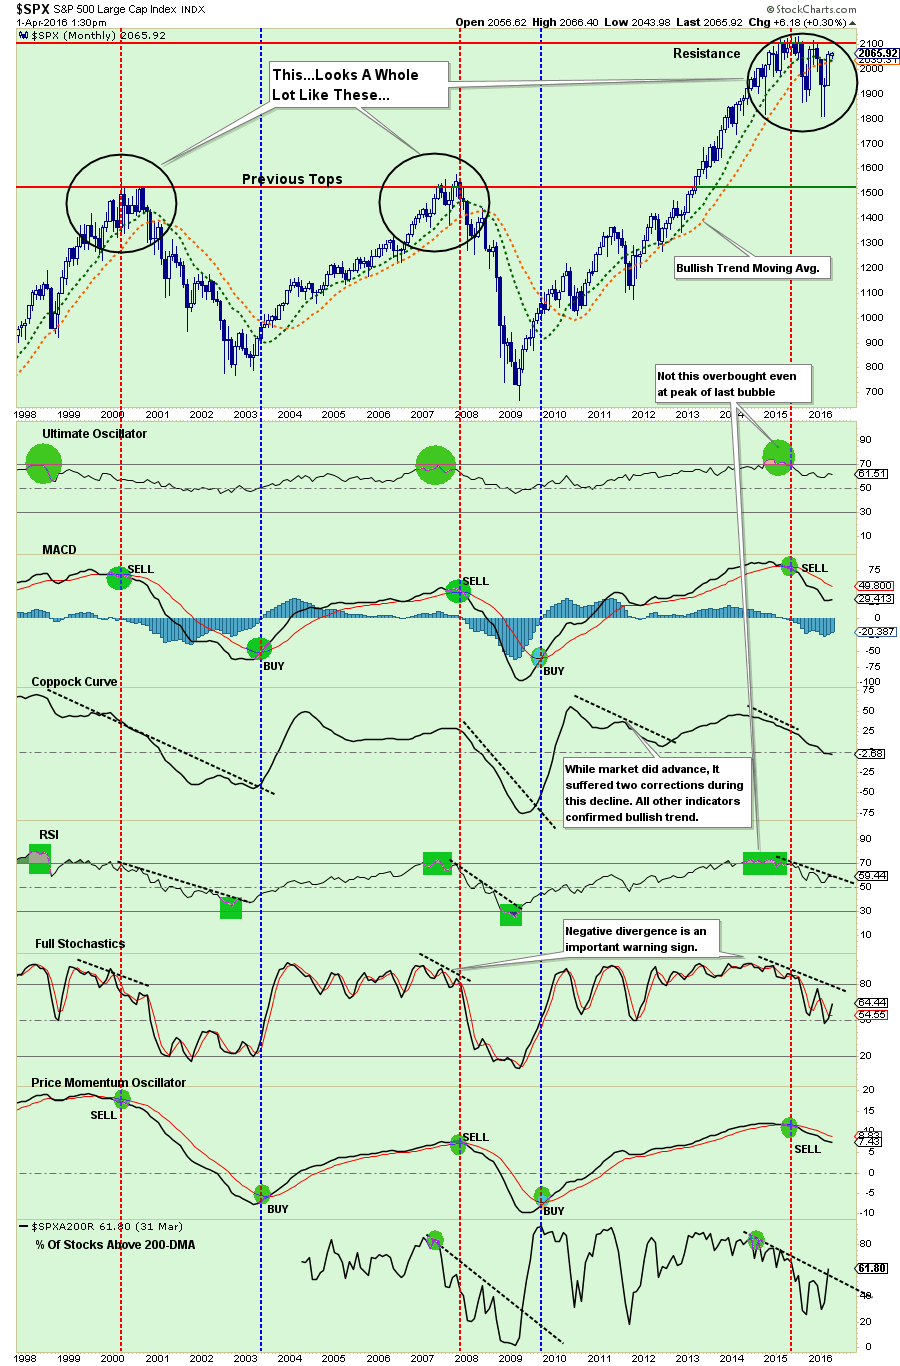
As you will notice, there has been virtually no improvement in longer-term indicators at this point that would suggest a more “bullish” optimism is prevailing in the markets.
At the very bottom of the chart above is the number of stocks trading ABOVE the 200-dma on the S&P 500. Currently, with the overall index trading well above the 200-dma, only 61.8% of stocks are currently doing the same. This suggests a rather narrow rally over the last month and explains the lack of momentum of the overall index.
CAUTIOUSLY OPTIMISTIC
As I stated two weeks ago in this missive:
“While my ‘emotions’ are currently screaming to start increasing equity allocations at this juncture, there are several reasons why my discipline is keeping me from doing so currently:
- The market is GROSSLY overbought in the short-term and will have either a mild corrective process or consolidation to allow for an increase in equity exposure.
- Negative trends are still in place which suggests the current rally, while significant, remains within the context of a reflexive rally.
- Volume is declining on the rally suggesting a lack of conviction.
- This rally looks very similar to the rally last October except the fundamentals are substantially weaker.
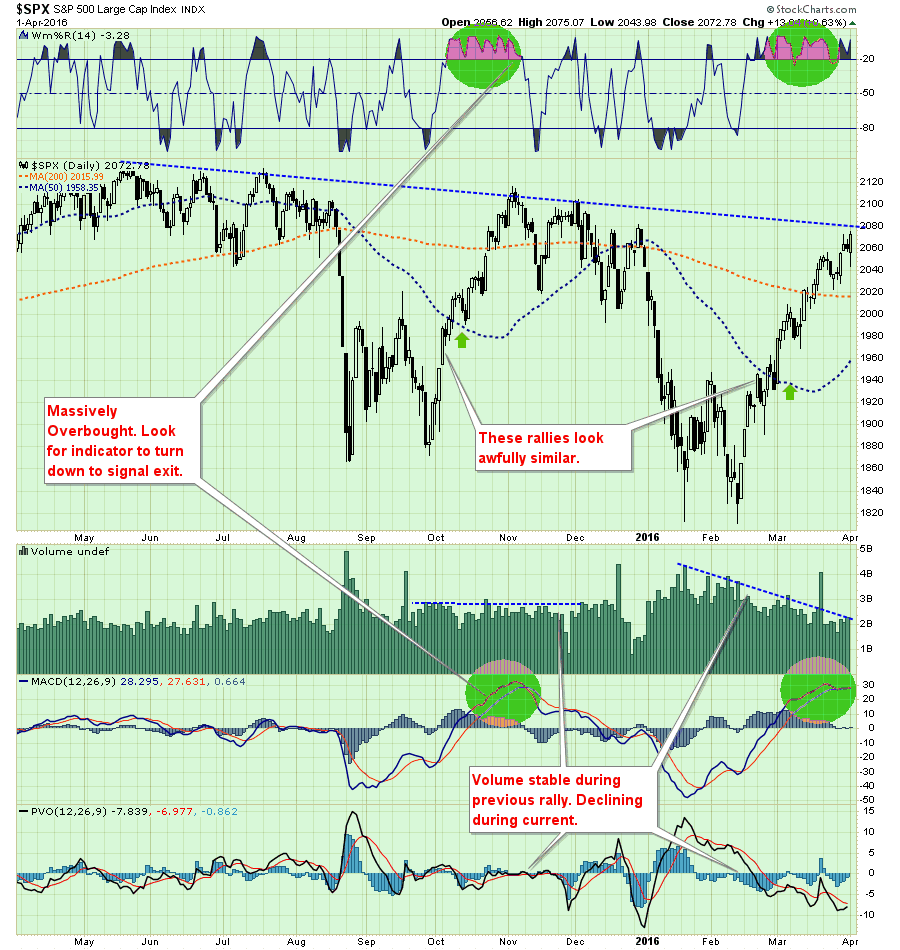
While the shorter-term indicators are becoming decidedly more bullish, the fundamental and economic backdrop still remains exceedingly week. Furthermore, with the majority of Central Bank actions now behind us, we are staring directly into the face of earnings season which will likely not be good.
So, while I am cautiously optimistic for an opportunity to increase equity risk exposure modestly in the short term, I also remain exceedingly cautious with a very quick “trigger finger” if I am wrong.
APRIL SHOWERS – EARNINGS & SEASONALITY
As we leave March behind and enter into the second quarter of the year there are several things that we need to focus on:
- Seasonal adjustments, which have given a massive boost to recent economic reports due to the unseasonably warm winter cycle, will begin to revert as temperatures realign with more normal seasonal patterns.
- While earnings estimates have been dropped markedly to allow companies to play the “beat the estimate” game, profits and revenues will likely show a sharper contraction that currently expected which will push current valuations higher.
- April winds up the seasonally strong time of the year and summer months tend to be weak particularly prior to Presidential elections.
Let’s examine the 2nd and 3rd points more closely.
As Adam Shell recently penned for USA Today:
“If there’s a dark cloud hovering over stock investors, it is the inability of U.S. companies to maximize sales and boost their bottom lines in a period of slow global growth, currency headwinds and still-low energy prices. A so-called “earnings recession” has descended on Wall Street. In the final two quarters of 2015, companies in the broad, large-company Standard & Poor’s 500 index have seen earnings contract — not grow. And analyst estimates for the first two quarters of 2016 also point to negative earnings growth.
Wall Street pros don’t see the profit picture improving until the second half of the year.
Currently, analysts are forecasting S&P 500 profit to contract 6.9% in the first three months of 2016, and to decline 1.9% in the second quarter.”
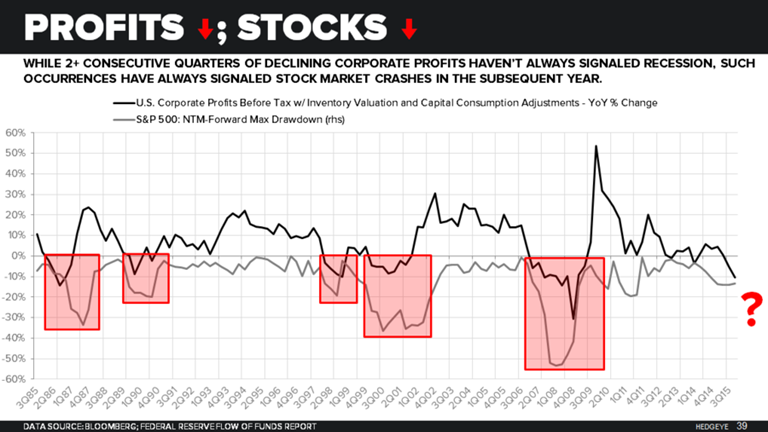
Here is the problem, such prolonged earnings recessions have never happened outside of recession and substantial market corrections. As noted by HedgeEye:
“While U.S. 4Q GDP was revised up to +1.4%, the corporate profit component showed a -10.5% Y/Y contraction. That marks the second consecutive quarter in which corporate profit growth was down Y/Y. Check out the chart below illustrating why that’s such bad news.
Bottom line? In the 30 years since 1985, two consecutive quarters of shrinking corporate profits have preceded a material stock market downturn over the next twelve months in all five occurrences.“
When it comes to seasonality, the picture doesn’t improve much.
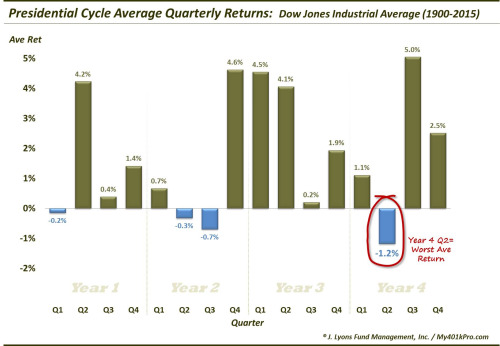
My friend Dana Lyons recently made the following observation:
“Using the Dow Jones Industrial Average (DJIA) since 1900, the 2nd quarter of election years (i.e., “year 4″) has the lowest average return (-1.2%) of any quarter in the entire cycle. Here are the average quarterly returns of the 4-year cycle in sequential order:”
One thing that financial markets absolutely detest is “uncertainty.” This is particularly true when a Presidential change is occurring and Wall Street is unsure what new policies may be enacted.
However, this year is likely to be more “uncertain” than usual with the potential mess coming from a contested Republican convention. Should the RNC decide to make a substantial nominee change, or clearly shift the outcome of the convention in an unexpected direction, an increase in market volatility this summer would certainly not be surprising.
Just something to think about.
The Monday Morning Call
The chart below shows the short-term view of the market beginning in April of last year. This chart coincides with the time frames of the subsequent analysis.
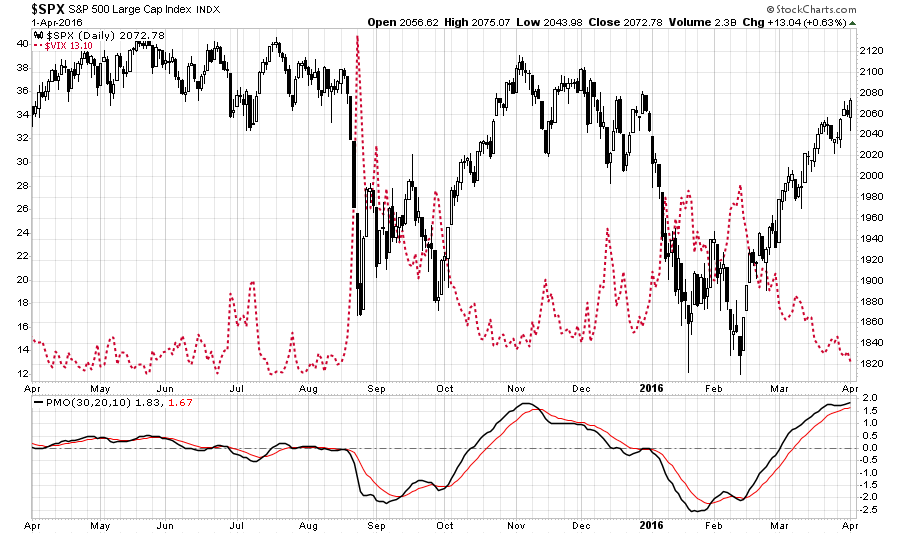
The rather brutal August and January declines see an increase in market volatility from extremely low levels and a decline in price momentum. The rallies subsequently took stocks to overbought levels which coincided with short-term market peaks.
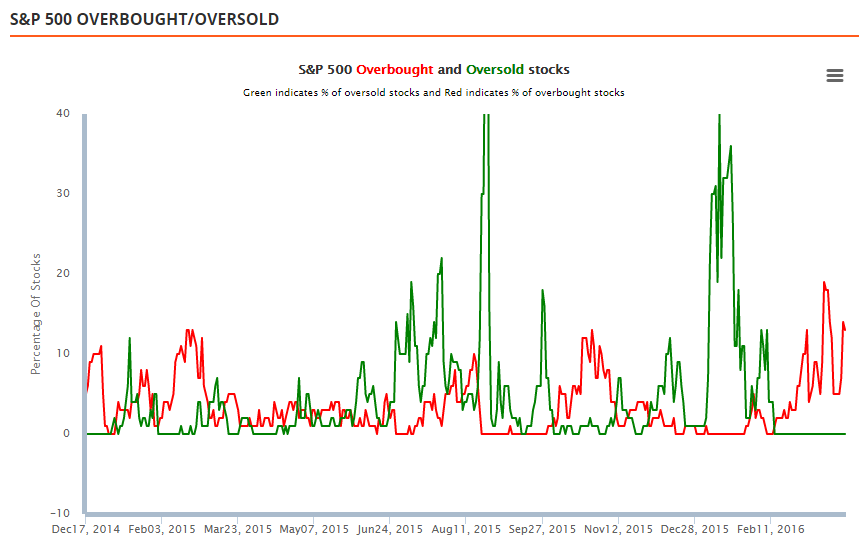
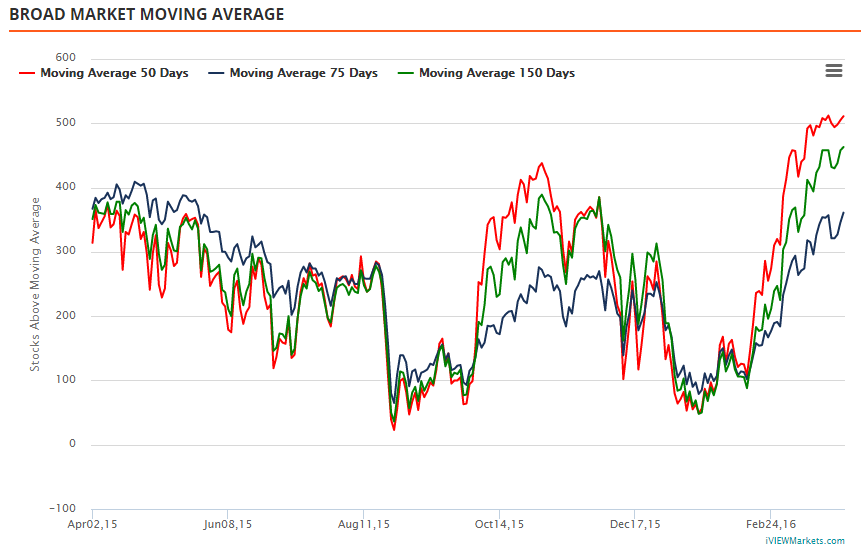
The same is currently seen with the number of stocks trading above their respective moving averages. Note that current levels exceed those seen during the October/November advance last year.
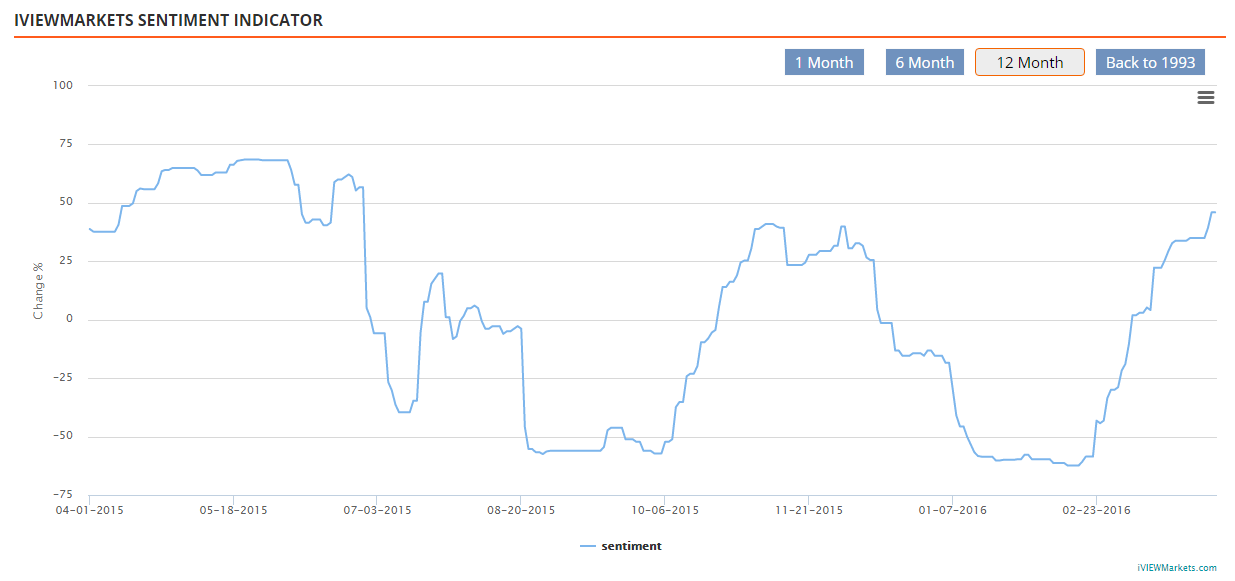
Investor sentiment has also reached levels that have normally been associated with short-term peaks in market advances.
While the technical underpinnings of the market have improved short-term, the risk of increasing equity exposure this coming week is not favorable. However, on a pullback to support, currently 2000-2020 on the S&P 500, a tactical increase to equity exposure in the strongest sectors of the market may be viable.
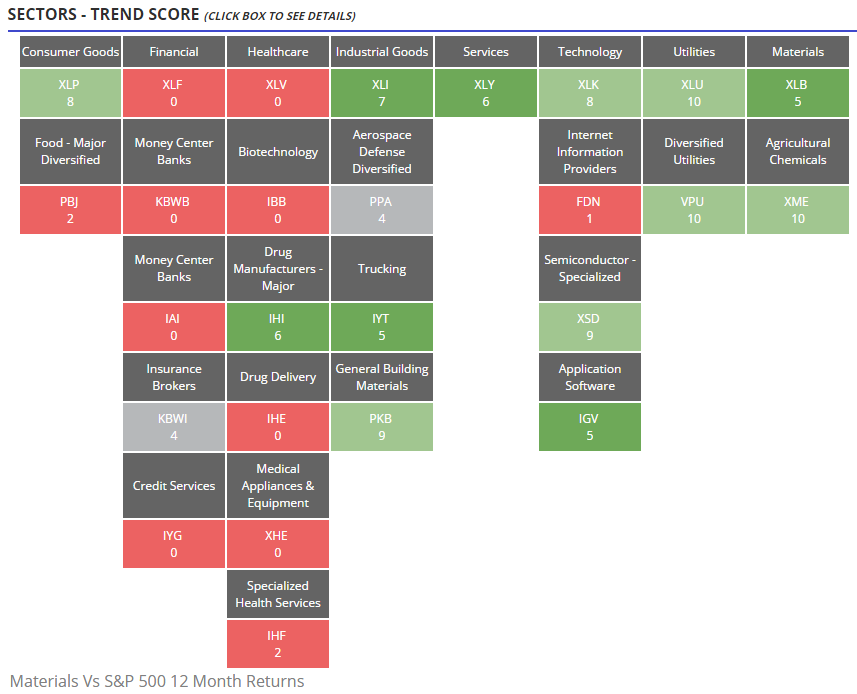
Currently, Utilities, Staples, Industrial Goods, Discretionary, Technology & Materials are the most viable options. There is still too much short-term risk within the Energy, Healthcare, and Financial sectors to be aggressively allocated in these areas.
S.A.R.M. Model Allocation
The Sector Allocation Rotation Model (SARM) is an example of a basic well-diversified portfolio. The purpose of the model is to look “under the hood” of a portfolio to see what parts of the engine are driving returns versus detracting from it. From this analysis, we can then determine where to overweight sectors which are leading performance, reduce in areas lagging, and eliminate those areas that are dragging.
Over the last couple of weeks, RISK based sectors have improved somewhat while SAFETY sectors have weakened. This is something I suggested had to occur previously as defensive sectors were extremely extended in terms of relative performance measures.
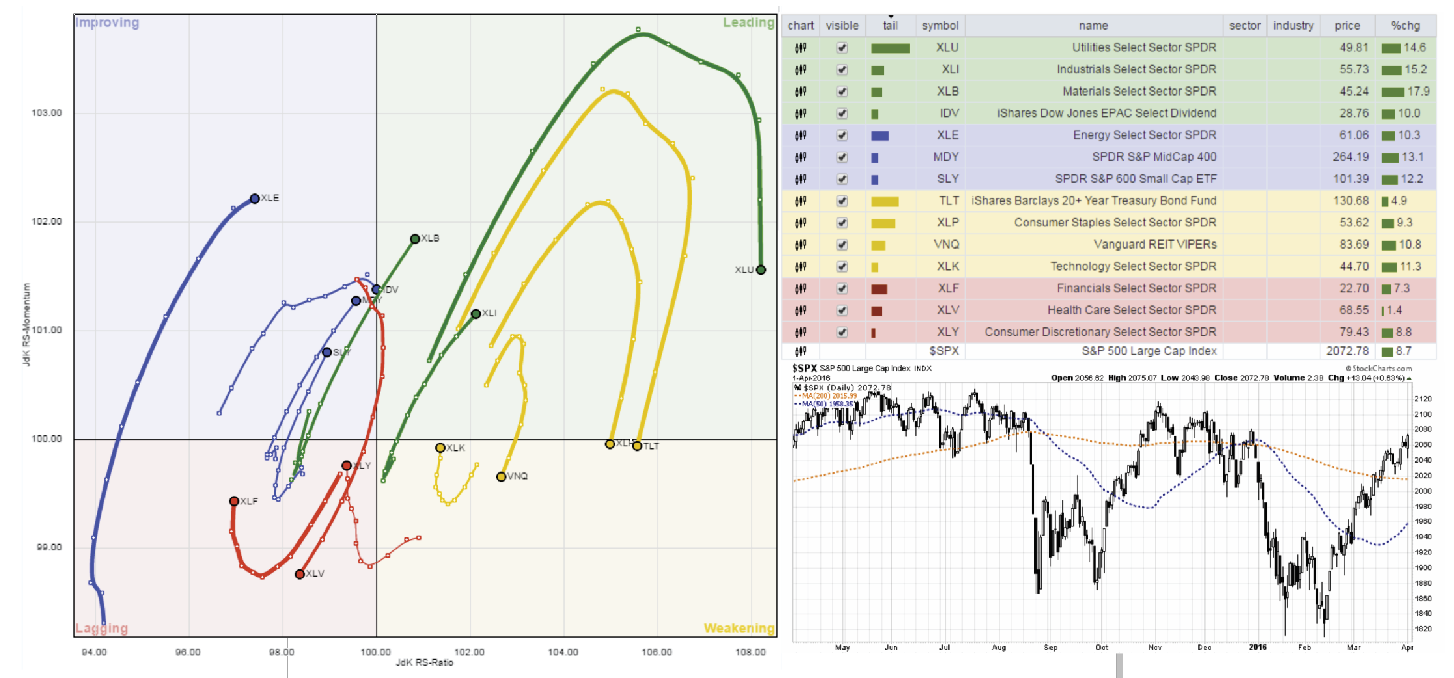
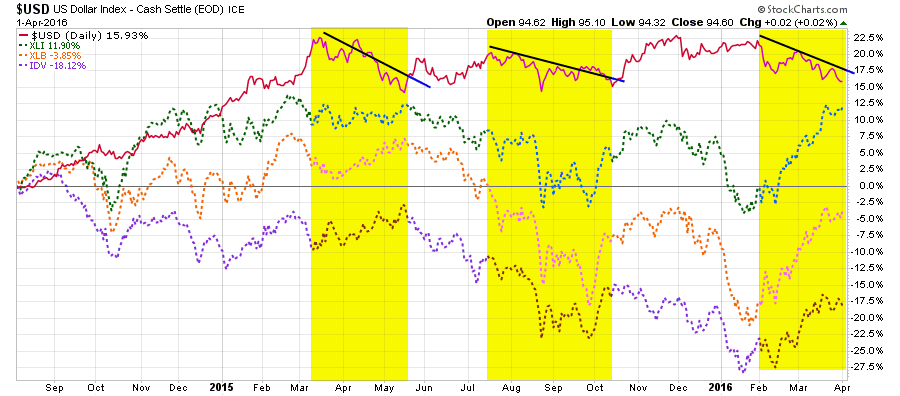
Industrials, Materials, and International sectors have been leading the charge over the last couple of weeks due to the decline in the US dollar. Interestingly, while the dollar has weakened somewhat, it is still well within the confines of its recent trading pattern. Furthermore, the recent advance in these sectors is out-sized relative to the previous declines in the dollar last year which suggests a short-covering squeeze in play.
Energy, Mid-Cap, and Small-Cap stocks have improved but are still lagging the S&P 500 index as a whole. Mid and Small-Cap sectors are also still well within a major downtrend. Furthermore, the companies that comprise the indices are most susceptible to economic weakness so caution is highly advised.
Not surprisingly, the SAFETY sectors have begun to lag the broader market with Bonds, Staples, REIT’s slowing their advance. I suggested adding bonds to portfolios several weeks ago when yields approached 2% and to date that has been a good call. I still suspect we will retest yield lows, or set new lows, by fall of this year.
Technology is trying to improve in the last week but is still lagging the S&P 500 as a whole.
Financial, Healthcare and Discretionary companies continue to lag at this point. While Discretionary stocks performance has improved in recent days, it is still too early to increase weightings to the sector currently.
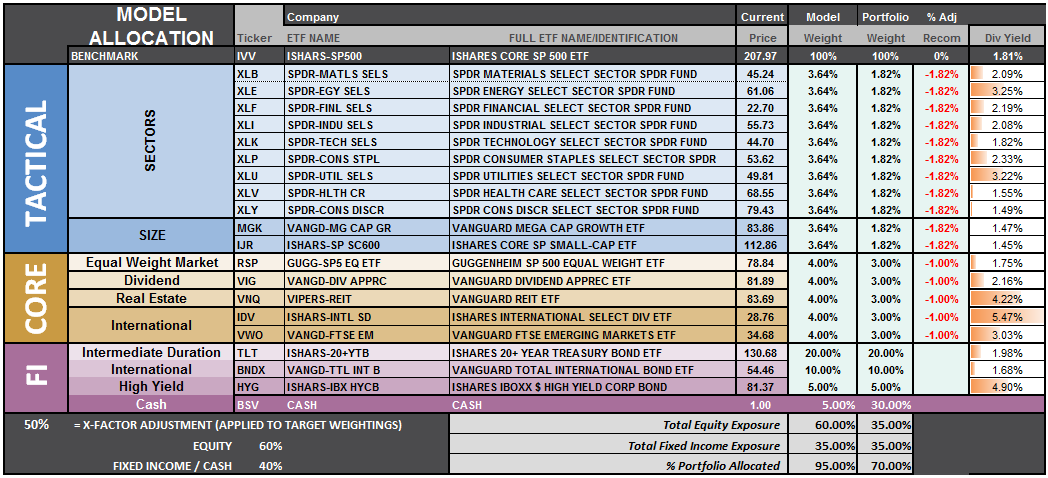
I am updating the S.A.R.M. model to reflect potential portfolio allocation changes provided the market takes a slight breather to reduce the extreme overbought conditions that currently exist. This would move the current model allocation exposure back to 50% of Target Weightings in an equally weighted portfolio.
The relative performance of each section of the model is then compared to the S&P 500 for relative performance. Interestingly, despite a “strong March rally”, sectors that were strongly leading the S&P 500 have now begun to lag a bit suggesting weakness is creeping in. More importantly, most sectors are still on longer term “sell signals” as the weekly moving averages remain negatively crossed. A confirmation of a resumed bull market will be validated when the majority of “risk-based” sectors are positively biased.
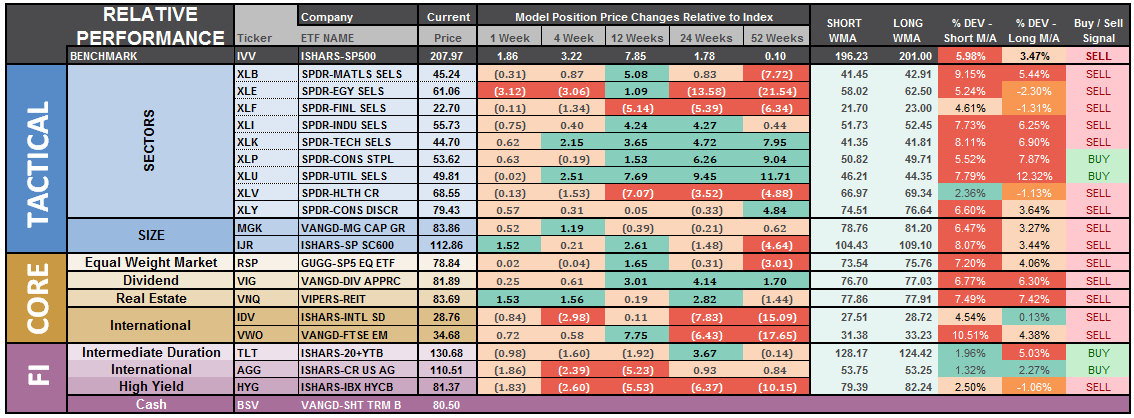
However, if the market does allow for an increase in equity exposure through a consolidation process, an increase in the model allocation to 50% of target weights will take model allocations to the following:
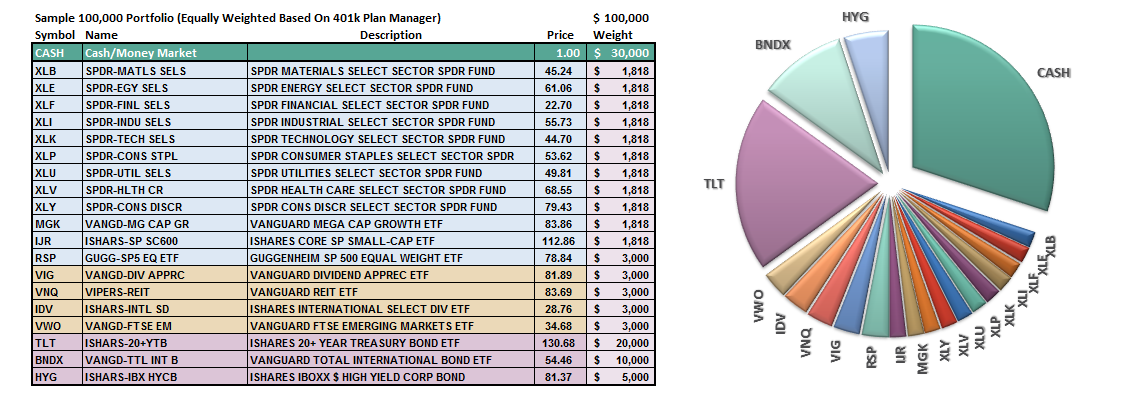
However, as of this week, the portfolio model remains unchanged with CASH to 50%, 35% in bonds, and 15% in equities. Again, if the markets pull back to support, without violation of said support, I will suggest an increase in equity allocations.
This aligns with what I said in the previous newsletter:
“It is completely OKAY if your current allocation to cash is different based on your personal risk tolerance. This is just a guide.
If the market can pull back and establish a higher low AND simultaneously move the markets back into an oversold condition, such would likely provide a reasonable opportunity to increase short-term equity exposure.
However, for longer-term investors, we need to see an improvement in the fundamental and economic backdrop to support a resumption of the bullish trend. Currently, there is no evidence of that occurring.”
THE REAL 401k PLAN MANAGER
The Real 401k Plan Manager – A Conservative Strategy For Long-Term Investors
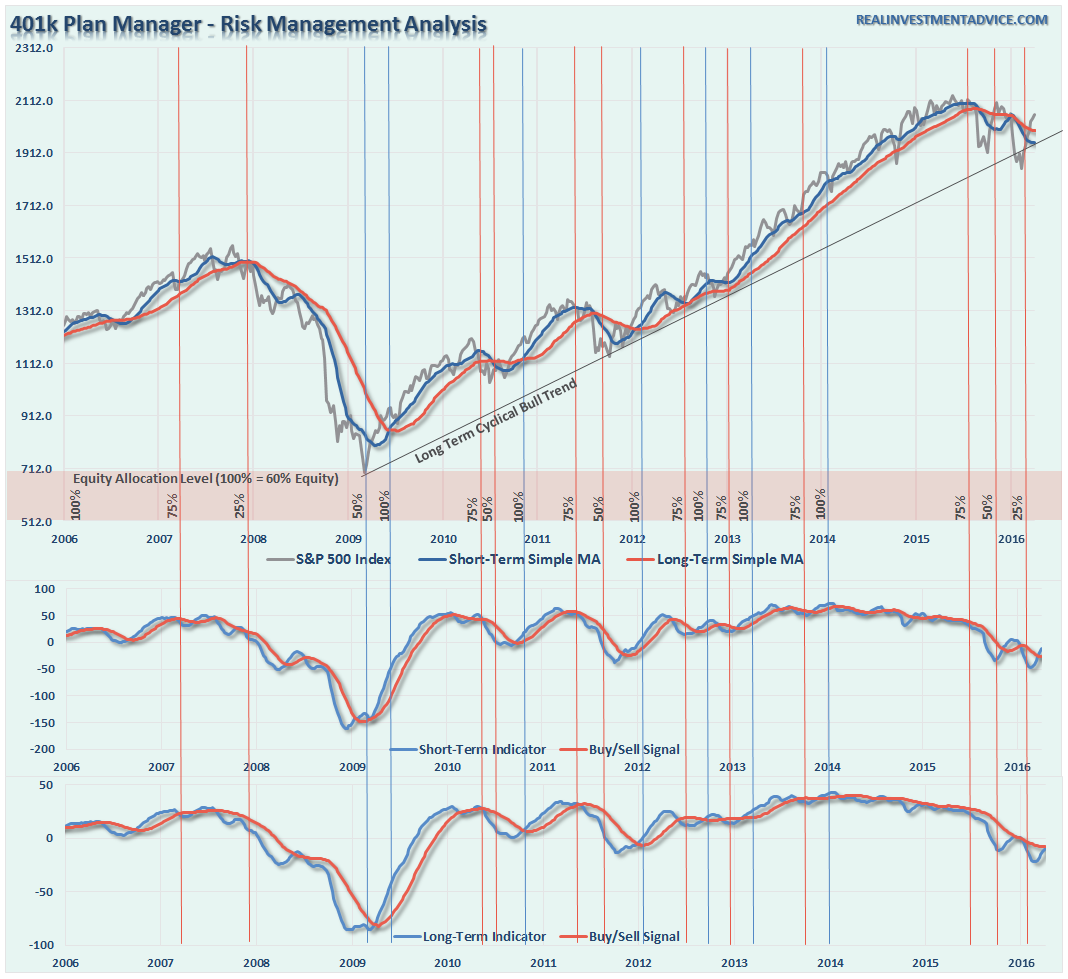
There are 4-steps to allocation changes based on 25% reduction increments. As noted in the chart above a 100% allocation level is equal to 60% stocks. I never advocate being 100% out of the market as it is far too difficult to reverse course when the market changes from a negative to a positive trend. Emotions keep us from taking the correct action.

Buy Signal Approaches (But Will It Stick?)
While the market rally was quite exceptional over the last few weeks, it has done little to change the currently negative market trends back to positive. As shown in the 401k portfolio manager chart above, all sell signals remain in place currently with the exception of the short-term “ALERT” indicator. This initial signal suggests that we begin to watch for “confirmation” of a turn in the markets back to positive.
However, as I stated over a month ago:
“…some event (exogenous, monetary or fiscal) could occur which would render such analysis incorrect. If such an event occurs, we will re-evaluate holdings and readjust accordingly.”
Those events were the ECB’s unleashing of their “QE Bazooka” combined with the Fed’s failure to hike interest rates, and ultra-accommodative language gave a boost to stocks for the month.
With those “supports” now in the rear-view mirror, the attention of the markets will now turn to economics and earnings. The problem here is that neither one is supportive of higher asset prices.
I suspect the current “bullish action” will likely fail as we head into the summer months. With the technical damage to the market remaining over the intermediate and longer-term time frames, the reward of aggressively increasing allocations currently is still outweighed by the risk.
For longer-term investors, the markets have made virtually no progress since January of 2015. Therefore, there is little evidence to suggest stepping away from a more cautionary allocation…for now.
Current 401-k Allocation Model
The 401k plan allocation plan below follows the K.I.S.S. principal. By keeping the allocation extremely simplified it allows for better control of the allocation and a closer tracking to the benchmark objective over time. (If you want to make it more complicated you can, however, statistics show that simply adding more funds does not increase performance to any great degree.)
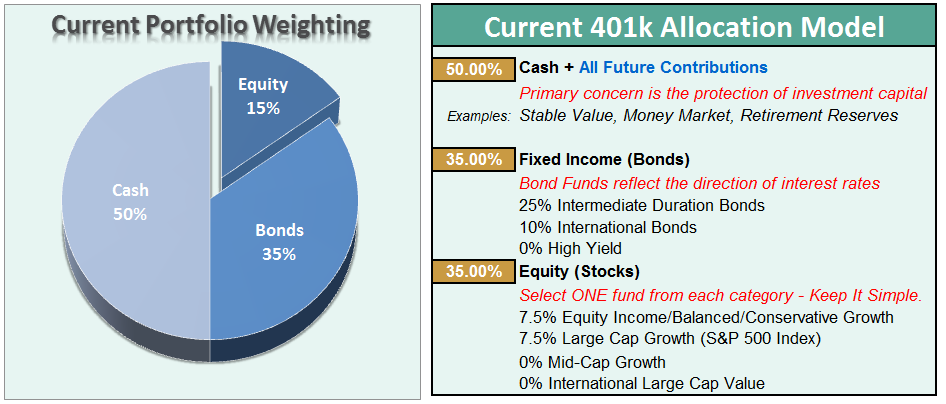
401k Choice Matching List
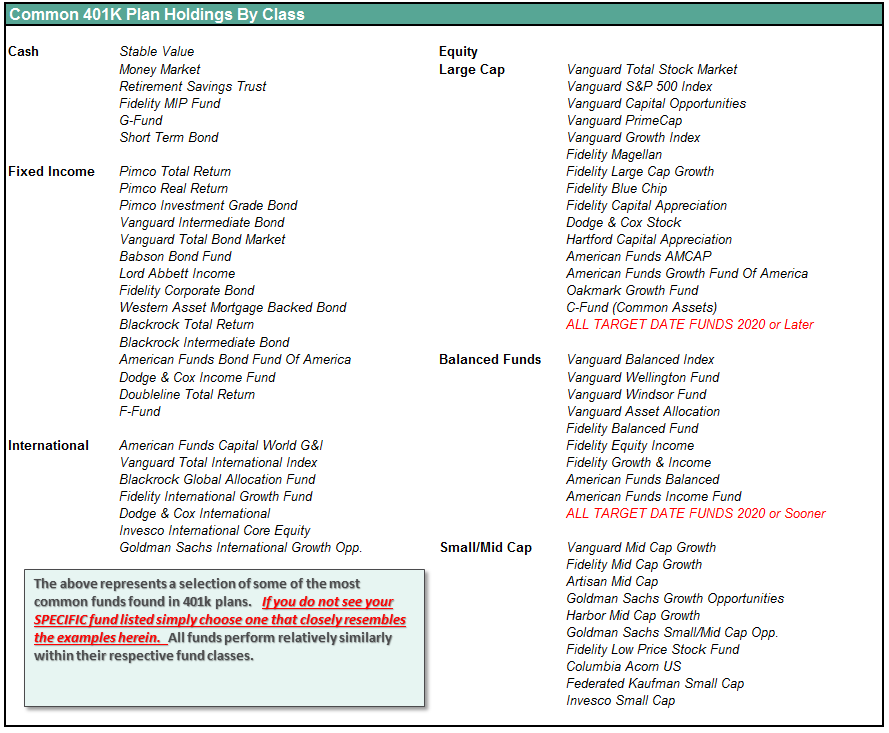
The list below shows sample 401k plan funds for each major category. In reality, the majority of funds all track their indices fairly closely. Therefore, if you don’t see your exact fund listed, look for a fund that is similar in nature.
