Quite an eventful period since the last Stock Trading Alert on Sept. 11 – stocks rose on Sept. 14 and Sept. 15, validating the short-term bullish outlook presented in the alert. Next, the S&P 500 made two downswings before rebounding from the 3200 level proximity on Sept. 24. Friday's session brought us a daily upswing, and so did Monday. Where does yesterday's stumble fit in?
Volatility has been moving generally lower after making a lower high days ago. Technology plunged but didn't make a new low on Thursday. Otherwise, there have been few sectoral bright spots, with financials and energy still looking precarious. On the bright side, consumer discretionaries, utilities and consumer staples (the latter two are defensives) have held up reasonably well – better than healthcare.
But what moved the markets when it comes to headlines? Political uncertainties remain, the first presidential debate is over, and there is still no stimulus bill, while the coronavirus is getting worse overseas. New lockdowns are hanging in the air, with the U.K. and Israel leading the way. Then, the Fed hasn't done all that much lately, leaving the credit markets relatively unfazed. Continuing claims are trending lower only painfully slowly, and U.S. tensions with China haven't seen a turnaround.
So, are we witnessing a typical pre-election correction? I think that's most likely the case. September brought us a bigger storm than October based on the 2016 experience would, and it's reasonable to expect the remaining S&P 500 downside (unless the current upswing turns into a dead cat bounce) to be relatively modest.
Let's check the charts' messages.
S&P 500 In Medium and Short-Run
I’ll start with the weekly chart perspective (charts courtesy of http://stockcharts.com ):
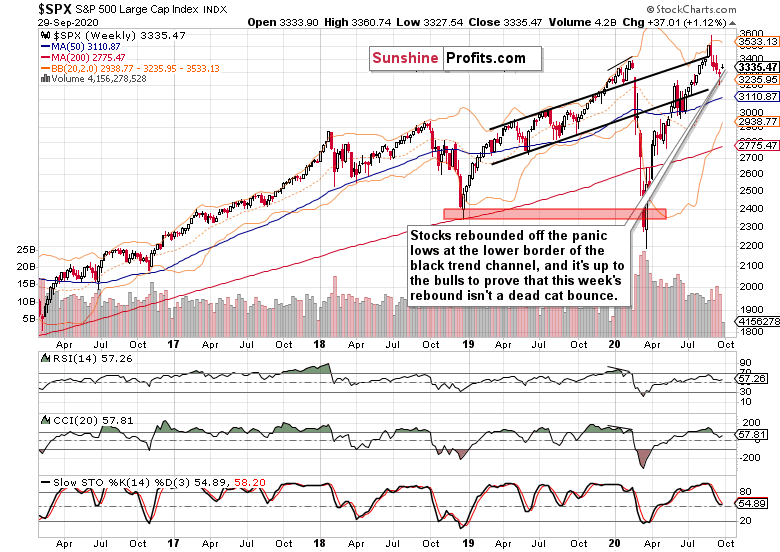
Stocks plunged all the way to the lower border of the rising black trend channel, and subsequently rebounded. The lower knot of last week's candle and the upper knot of the week in progress hint at a short-term indecision. The weekly indicators support the notion that there is not much downside left in this correction.
Let's check the daily chart whether it supports my assessment or not.
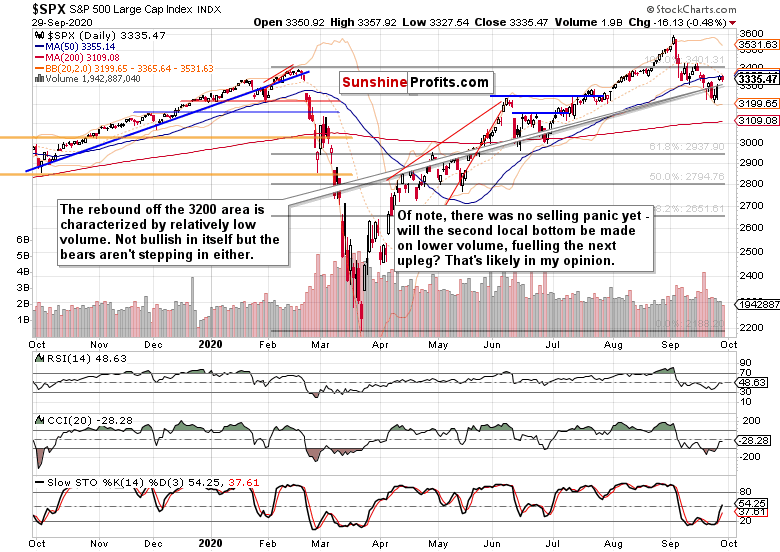
Having visited the 3200 level, S&P 500 futures rebounded, but the volume isn't totally convincing. That makes the recovery less credible. On one hand, there hasn't been a selling climax thus far yet. On the other hand, unless momentum and volume pick up to the downside, any potential second local bottom would be made on lower volume (or, prices would instead consolidate sideways before another leg higher).
Either way, the bulls are in a slightly more advantageous position now. That's especially so given the smaller volume of yesterday's daily stumble.
Credit Markets’ Point Of View
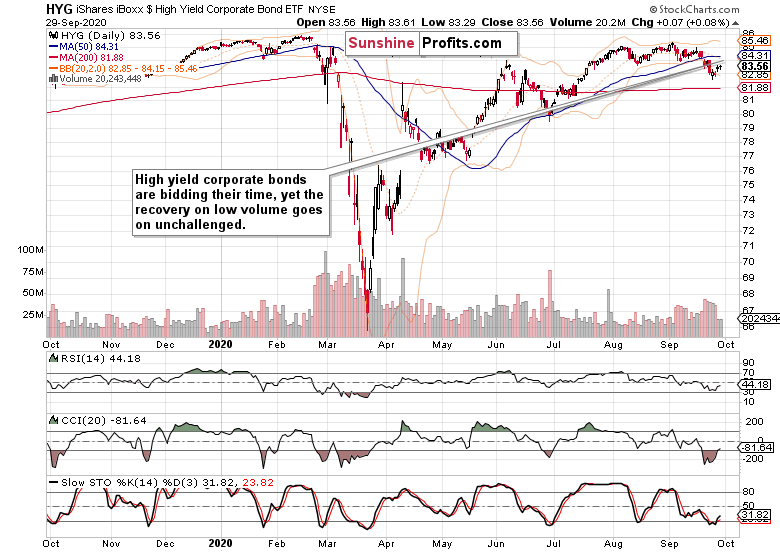
High-yield corporate bonds (HYG ETF (NYSE:HYG)) have rebounded, but the weak volume is a cautionary sign. In my opinion though, it's more likely than not that Thursday intraday lows would hold. Examination of investment grade corporate bonds (LQD ETF (NYSE:LQD)) though still warrants short-term caution, until resolved.
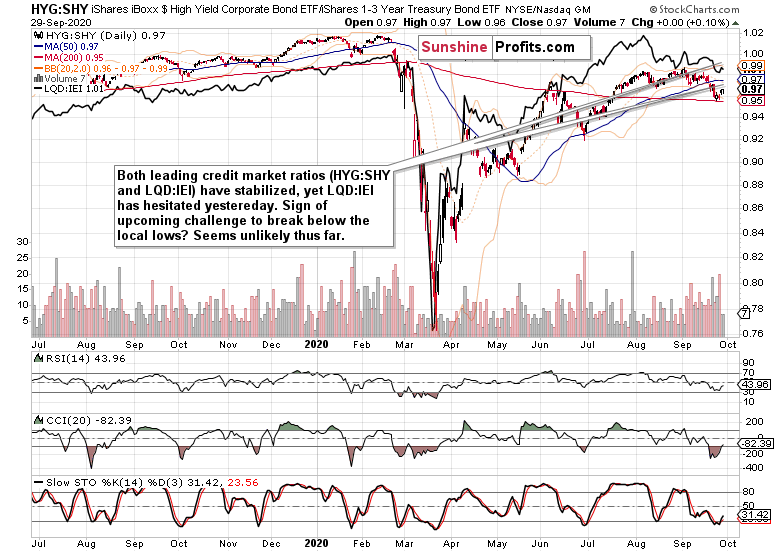
A glance at both leading credit market ratios – high-yield corporate bonds to short-term Treasuries (HYG:SHY) and investment-grade corporate bonds to longer-dated Treasuries (LQD:IEI) – highlights that perfectly. LQD:IEI hesitated yesterday in what appears to be a daily pause. Again, I don't see a break below either's local lows as my go-to scenario at the moment.
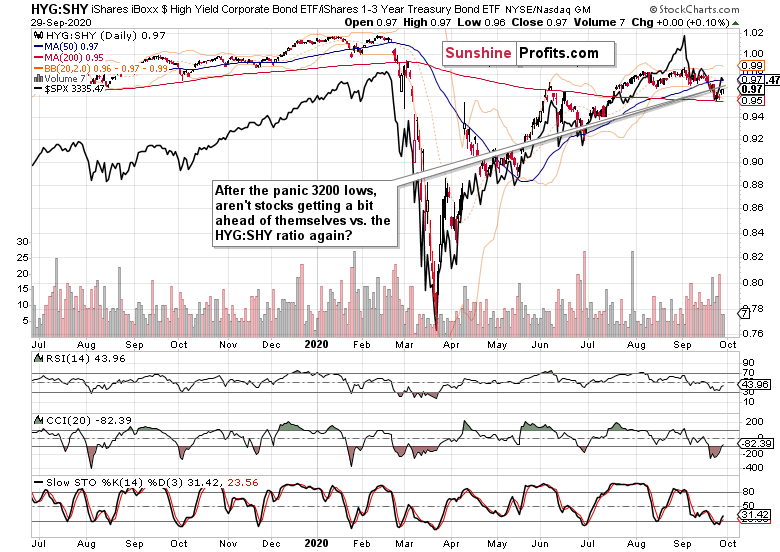
Finally, let's check whether stocks are extended relative to the HYG:SHY ratio, or not. And they are. Or, is it that stocks are leading higher? Both points are true in my opinion right now, and I look for stocks to facilitate the HYG:SHY ratio's eventual upswing. Yes, that means I see quite limited downside potential in stocks.
Summary
Summing up, stocks have rebounded from a relatively protracted local bottom, and appear ready to gradually assume trading with a bullish bias again. Market breadth indicators appear favoring the bulls with each passing day without a profound downswing that would pull the advance-decline line dramatically lower.
The U.S. dollar has met its fair share of short-term selling pressure, and unless the bulls assume the initiative and overcome the September peak, I'm not looking for risk assets to get under too much pressure.
Cautiously bullish outlook is warranted, and the bulls that have been waiting on the sidelines for the dust to clear up, wouldn't be hurt by exercising patience in the lookout for a more favorable short-term entry point than is the case this very moment (S&P 500 futures at 3318).
