Pundits seem to comment on elements outside their comfort zone (areas of real expertise). Everyone is guilty from time-to-time. I know my comfort zones, and one is in labor and labor dynamics which formerly was the major part of my last life.
My least read analysis are ones on productivity – a particularly boring subject which most understand is important to profitability and competitiveness. Some believe it is a major building block of GDP. (The way productivity is calculated by the economists – it uses GDP components.) Following economic updates on productivity are the equivalent of being forced to watch snail racing on ESPN.
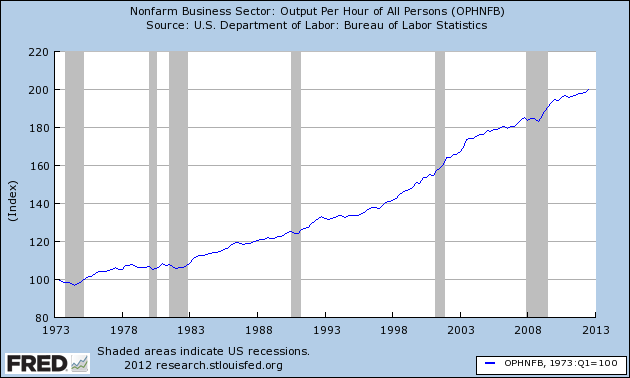
Here is the way the bean-counters and economists view productivity.
Productivity in the above graph is calculated by dividing real output by hours worked. If a component was outsourced, this would be considered a productivity improvement. In my posts, I have constantly complained about this view of productivity:
My view of productivity is one of an industrial engineer, while the Bureau of Labor Statistics (BLS) are bean counters using a simple hours vs output approach. Although one could argue that productivity improvement must be cost effective, it is not true that all cost improvement are productivity improvements.
There is no way for a bean-counter to understand productivity. They only understand that a product is being made cheaper, and not exactly why. But not understanding underlying dynamics sets you up for drawing the wrong conclusion. From my point of view, real productivity has improved little in the USA since 2000, and this is part of the dynamic which lead into the Great Recession.
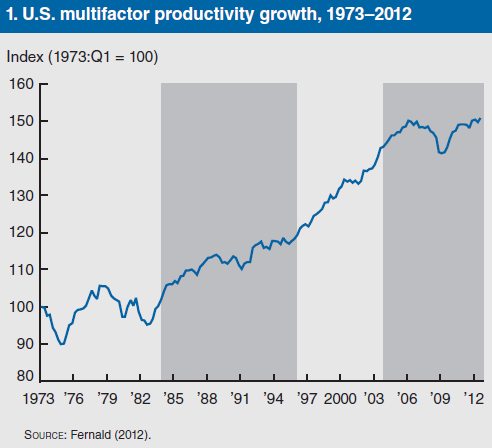
SF Fed Macroeconomic Researcher John Fernald, comes closer to quantifying real productivity (his paper at the SF Fed). He utilizes a multifactor method of quantifying productivity.
multifactor productivity – combines estimates of labor inputs with estimates of other factors of production, such as capital, in proportion to their importance in production. 
The chart above identifies four distinct periods of productivity growth.
- Ten years of productivity slowdown beginning in 1973.
- A period of modest growth of productivity that continued into the mid-1990s.
- A multifactor productivity growth spurt of 1.7% per year.
- A dramatic decline beginning in 2004 in the rate of growth of multifactor productivity to about 0.5% per year, caused by labor and capital being underutilized following the initial recovery from the 2001.
The Chicago Fed has mused over this multifactor productivity slowdown beginning in 2004:
- Is it perhaps simply a problem of measurement related to the increasing share of the economy devoted to services—in particular, business and financial services—for which it is difficult to measure output (and, hence, productivity)?
- Or is it perhaps due to a more widespread problem with the measurement of intangible investments?
- Alternatively, might it be due to the exhaustion of the gains from the information technology revolution?
- Or to declines in the quality of education and, hence, the quality of the labor force?
- Or even to declines in government investments in infrastructure?
- Depending on the answer, slow measured productivity growth may be consistent with continued rising living standards or a period of stagnation in the developed world.
I can only shoot holes in this multifactor productivity methodology without offering an alternative. The economy is too complex to perform a real productivity estimate as each portion of each sector must be modeled using similar baselines. So one must step back and look for a proxy which provides a “good” (but imperfect) answer. An old boss, after smashing me on my head with my slide rule after making an order of magnitude error told me:
If you do not know the answer before you calculate, chances are your answer will be wrong.
Calculations are done to prove your answer – and if the answer and calculation result differ, you need to go back and re-postulate and / or recalculate.
This multifactor productivity approach is an improvement as it calculates productivity closer to my answer. Productivity growth historically is never a straight line as the BLS productivity suggests. You cannot have real productivity growth without investment (tangible or intangible – or sweat in the case of a small business) – and this is why the multifactor method provides a better answer.
My belief is that the
- consumer demand curve began to change somewhere around 2000 creating too much USA capacity slack (you do not invest when you have excess capacity);
- in the same period the free trade agreements started to take hold moving investment overseas.
Even saying this is misleading – productivity is not a command feature of the economy. It follows in the aftermath of a significant technological breakthrough – say the personal computer. Adding to misery, productivity improvement implies less labor to do the same task – how much productivity improvement do you want with employment slack.
Productivity is one of the economic headwinds.
Other Economic News this Week:
The Econintersect economic forecast for December 2012 shows weak growth. The underlying dynamics continue to have a downward bent. There are recession markers still in play, and one of our alternate methods to validate our forecast is recessionary. All in all, not a great forecast – but not one which would cause you to jump out the nearest window either.
ECRI believes the recession began in July 2012. ECRI first stated in September 2011 a recession was coming . The size and depth is unknown. The ECRI WLI growth index value has been weakly in positive territory for over three months. The index is indicating the economy six month from today will be slightly better than it is today. 
Initial unemployment claims rose from 343,000 (reported last week) to 361,000 this week. Historically, claims exceeding 400,000 per week usually occur when employment gains are less than the workforce growth, resulting in an increasing unemployment rate (background here and here).
The real gauge – the 4 week moving average – continued to fall from 381,500 (reported last week) to 367,750. Because of the noise (week-to-week movements from abnormal events AND the backward revisions to previous weeks releases), the 4-week average remains the reliable gauge.
Weekly Initial Unemployment Claims – 4 Week Average – Seasonally Adjusted – 2010 (blue line), 2011 (red line), 2012 (green line) 
Bankruptcies this Week: UFood Restaurant Group, Edison Mission Energy, GuildMaster, Imagenetix, THQ
Data released this week which contained economically intuitive components (forward looking) were:
- Rail movements (where the economic intuitive components indicate a moderatelyslightly expanding economy).
- There were many important data releases this week which some use to forecast – durable goods, personal income – even gdp – I see little intuitive in these measures except trend lines.
All other data released this week either does not have enough historical correlation to the economy to be considered intuitive, or is simply a coincident indicator to the economy.
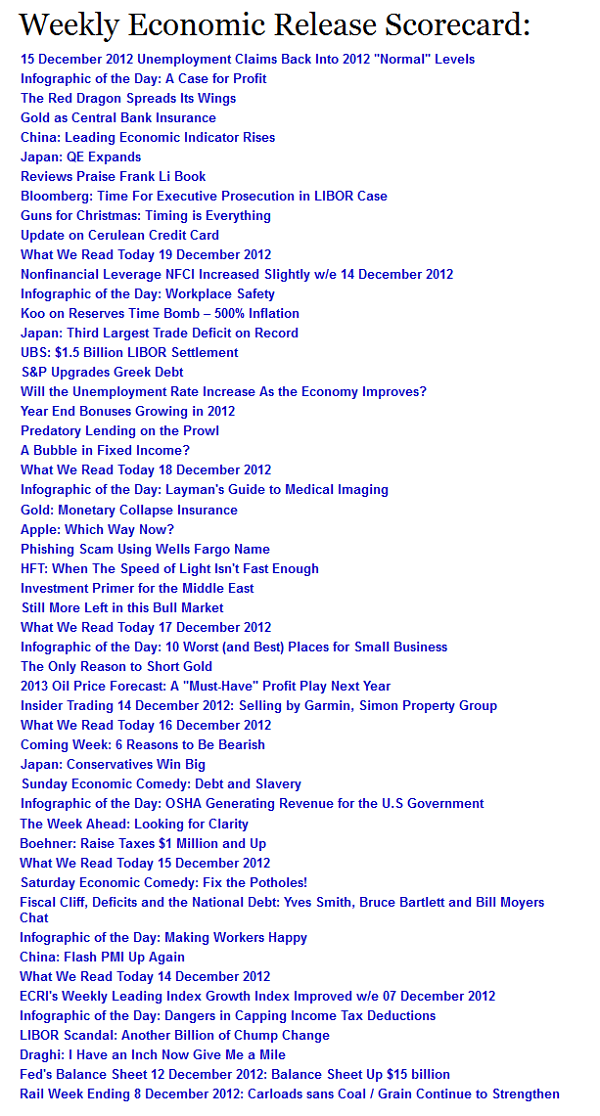
Click here to view the scorecard table below with active hyperlinks
