Get 40% Off
🚨 Volatile Markets? Find Hidden Gems for Serious Outperformance
Find Stocks Now

Poaching The Bond Cycle…..3.25.14

Published 03/28/2014, 05:49 AM
Updated 07/09/2023, 06:31 AM

Here’s the last word on iShares Barclays 20+ Yr Treasury (ARCA:TLT) vs. ProShares UltraShort 20+ Year Treasury (ARCA:TBT) (20 year treasuries vs its ultra inverse).  Despite all the news dynamics and geopolitical uncertainties it turns out that once treasuries find a support resistance channel prices tend to behave in a rather predictable manner.  This doesn’t mean we cast aside our money management stops…those stay in place….what it means is that once we identify these S/R cycles the odds for making money increase substantially.

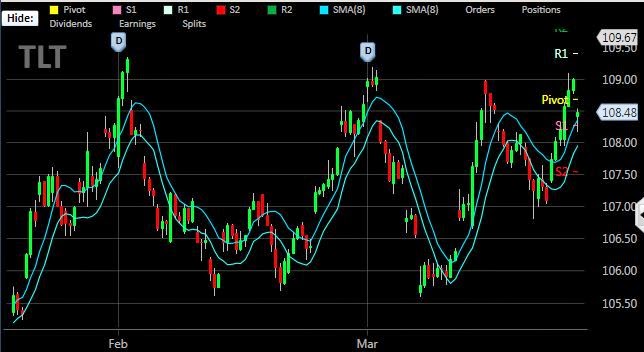
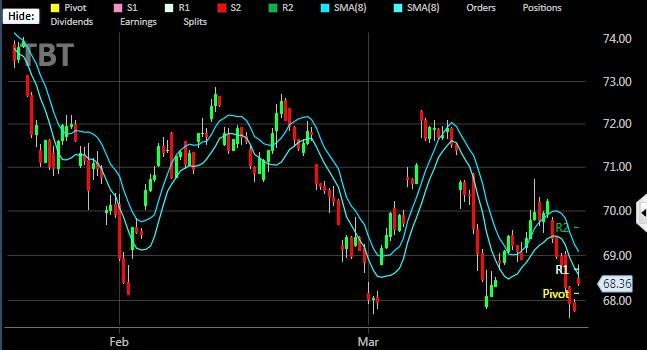
Below are the daily charts for TLT and TBT. 

TLT has a intraday range of about 1%, TBT, because its an ultra (x2) has a daily range of about 2%. (Just for reference SPY has a daily range of about 1.3%).

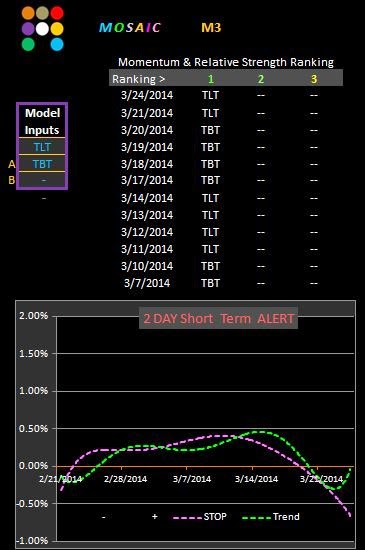
Following the 2 prices charts is the M3 setup…just 2 inputs.

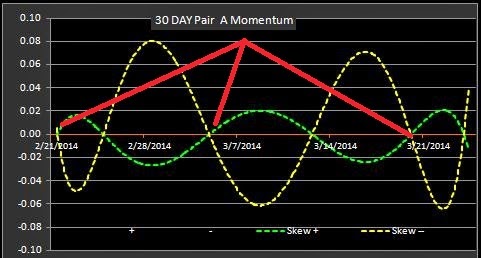
Then the M3 pairs analysis of the TLT/TBT skew. 

The red lines point to the zero line crosses that signaled the best odds for long TLT trades and/or short TBT trades.

So far the skew indicator has provided a good gauge of TLT momentum.  Just keep in mind that some factor will inevitably break the cycle (more tapering?).  When that time comes all bets are off until a new support/resistance channel is formed.

TLT
TBT
Mosica
30 Day Pair

Latest comments

Risk Disclosure: Trading in financial instruments and/or cryptocurrencies involves high risks including the risk of losing some, or all, of your investment amount, and may not be suitable for all investors. Prices of cryptocurrencies are extremely volatile and may be affected by external factors such as financial, regulatory or political events. Trading on margin increases the financial risks.
Before deciding to trade in financial instrument or cryptocurrencies you should be fully informed of the risks and costs associated with trading the financial markets, carefully consider your investment objectives, level of experience, and risk appetite, and seek professional advice where needed.
Fusion Media would like to remind you that the data contained in this website is not necessarily real-time nor accurate. The data and prices on the website are not necessarily provided by any market or exchange, but may be provided by market makers, and so prices may not be accurate and may differ from the actual price at any given market, meaning prices are indicative and not appropriate for trading purposes. Fusion Media and any provider of the data contained in this website will not accept liability for any loss or damage as a result of your trading, or your reliance on the information contained within this website.
It is prohibited to use, store, reproduce, display, modify, transmit or distribute the data contained in this website without the explicit prior written permission of Fusion Media and/or the data provider. All intellectual property rights are reserved by the providers and/or the exchange providing the data contained in this website.
Fusion Media may be compensated by the advertisers that appear on the website, based on your interaction with the advertisements or advertisers.
© 2007-2024 - Fusion Media Limited. All Rights Reserved.