High-level analytical assessments are oft said to be made from the "35,000-foot level." Such is the case here—literally—from said altitude above The Atlantic at a pace of some 603 knots by the cockpit display in the seatback in front of us. With the markets finishing the week by a shortened session on Thursday, plus our being in motion, we're getting a head start on this week's missive.
Now per that from last week's piece, "Gold's 1900+ Track Looks to Be in Santa's Sack," old Saint Nick doesn't seem to have come through with that pack. Moreover, peering into the gloom above the ocean as we transit from the Night before Christmas into its Day, nary have we seen any reindeer-driven sleigh. Part-and-parcel of the year 2020, one has to say.
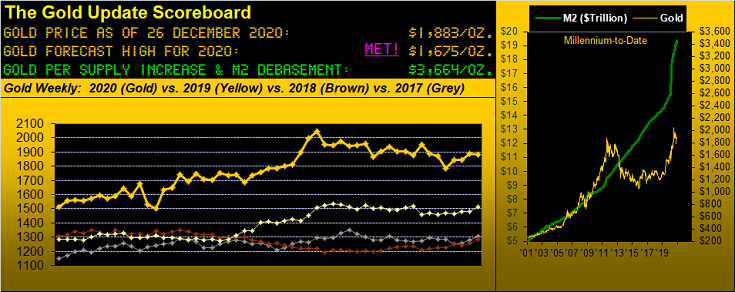
And yet, Gold per se has had a darn good year. In settling out the week at 1883, with but four trading days left in 2020, price year-to-date is +23.9%; further, Silver at 25.95 is +44.9%. So please no complaining; rather instead be rejoicing, 'cept we're not allowed to so do publically en masse, even if wearing a masque. Add, that up here in the air our computer at present says: "Unfortunately, there's no internet connectivity when flying above the Arctic Circle," and isolation seems everywhere.
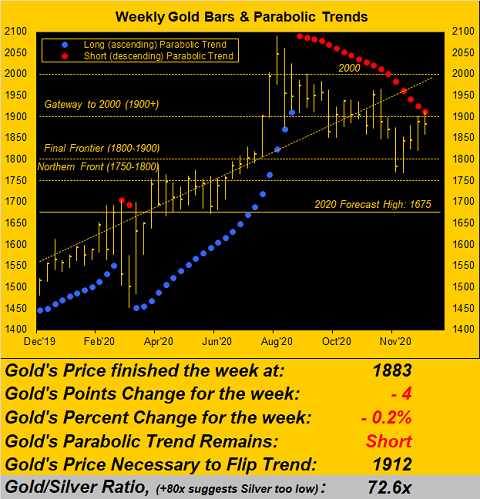
Fortunately we gathered most of our salient end-of-week analytics prior to wheels up, so let's get to it, beginning with Gold's weekly bars from one year ago-to-date. Santa may not have brought us Gold 1900+, but for the past two weeks price has teased that level, reaching on Monday up to 1912, the highest level since 09 November. And as was the case a week ago, Gold is well within range—now just 29 points—of eclipsing that same 1912 level which then flips the parabolic trend back to Long: Gold's expected weekly trading range is 74 points. So clearly a little old-fashioned end-of-year buying can get it done, the rightmost bar nudging its red dot:
Now our good man Squire is not on the scene, however we can hear his cautioning comments for Gold such as "But mmb, they'll sell Brexit agreement getting done" or "they'll sell COVID relief getting done" (and then some?). Perhaps. Yet why sell Gold at 1883 when by the opening Scoreboard's debasement value 'tis pegged at 3664? Or why sell Gold when the "live" price/earnings ratio of the S&P 500—with Tesla (NASDAQ:TSLA) now a constituent—is 67.2x? 'Tis not a typo; rather 'tis on beyond stooopid. (Note, too, the mighty Index's yield is but 1.514% whilst that on the Bond is 1.662%; surely your money manager has brought this to your attention, right?)
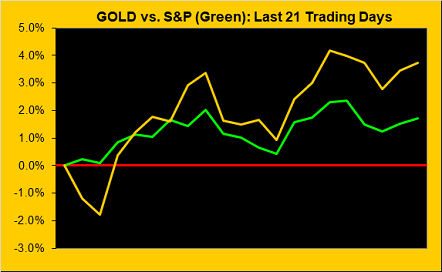
Nonetheless, hardly are Gold and the S&P in negative correlation with one another; rather per this view of their respective percentage tracks from a month ago-to-date (21 trading days), 'tis more of an encore performance of their classic pas de deux:
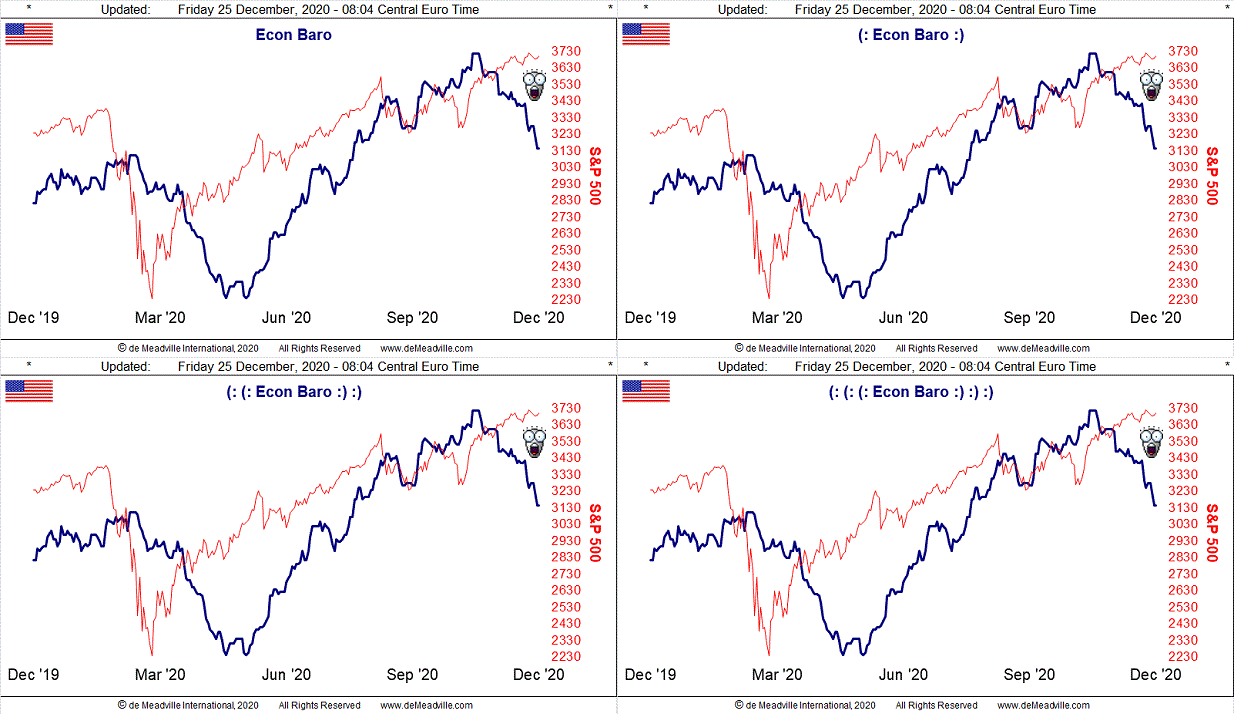
So as the S&P 500 climbs merrily along without any substantive earnings support, neither is the economy providing same, the Economic Barometer being bruised for the third consecutive week. Lowlights included a significant slump in the Conference Board's reading of Consumer Confidence for December, November's Personal Income shrinking for the second consecutive month, and Personal Spending deflating as well. Also, the month's New Home Sales slowed. Thus for the Baro, all is not well, (and for the S&P, pray don't tell):
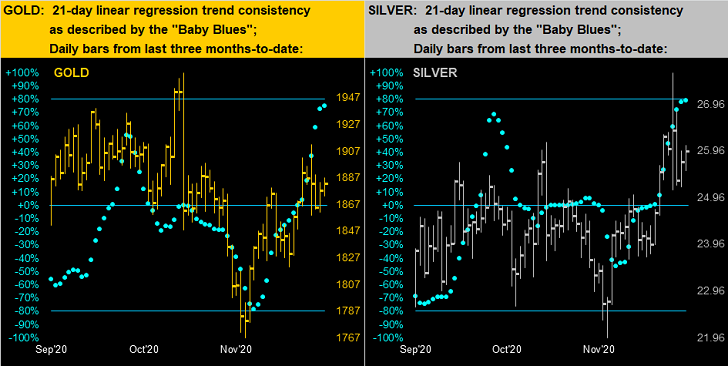
As for the Federal Reserve and govermental stimulus train, their debasing activities ought well be working for further Gold gain. To be sure, in turning to the three months of daily bars for Gold on the left and for Silver on the right, the "Baby Blues" of linear regression trend consistency have been firmly on the rise, those for both metals now nearing their respective +80% axis in confirming the uptrend as intact. Again, having the weekly parabolic Short trend flip to Long in the year's final week ought well induce a further upside streak:
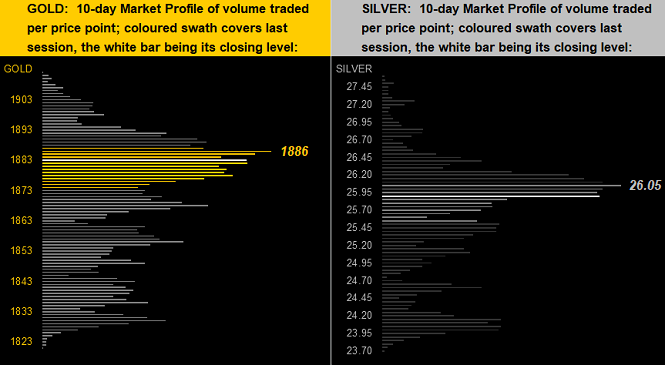
And as for the 10-day Market Profiles for Gold (below left) and Silver (below right), price at present for both metals is right 'round the past two weeks' most dominantly traded levels, those being 1886 for the yellow metal and 26.05 for the white metal:
So there it all is, the great jet having raced the sun and placed us already nine time zones further eastward into Saturday. Remaining is but another brief trading week ahead to close out the year, indeed to close out this—the second decade—of the 21st Century. And by any which way 'tis valued, let not your wonderful life be cancelled, for Gold is poised to race ahead of where IT is!
See you next decade, (i.e. next Saturday), with our outlook for Gold in 2021!