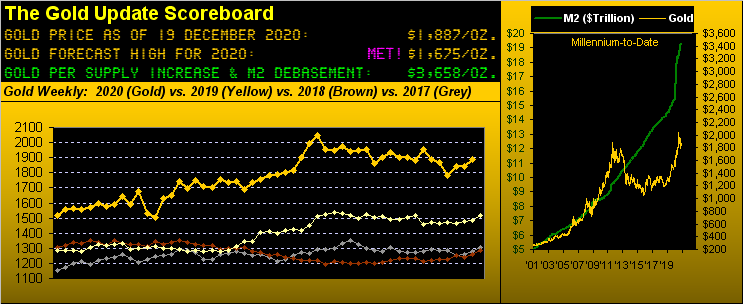
It being toward year-end, indeed that for the decade, our good friends over at Investing.com again asked us to soothsay that which we see for next year. Thus we also think it apropos by which to herein open as follows:
Toward 2021: Gold and the S&P 500
Gold: A year ago in this paragraph we penned: “…priced per this writing at $1,482, our valuation measure by debasement alone of the U.S. money supply (M2) is Gold $2,991. No, price shan’t rocket up that far in 2020…”
With Gold today priced at $1,890, our debasement value of Gold is $3,600: and given all the additionally COVID-induced debasement, Gold ought have a super 2021, perhaps not reaching all the way to $3,600. But should history yet again repeat, Gold eventually shall catch up to debasement value: thus price remains terrifically undervalued and shall move up into uncharted territory above the recent all-time high of $2,089 as 2021 unfolds.
The S&P 500: A year ago in this paragraph we penned of : “…the President being re-elected…but the Trade of the Year is to sell the S&P going into Election Day…”
Wrong we were. And yet the S&P is now even more excessively expensive as we’ve ever seen it: upon Tesla (NASDAQ:TSLA) being added to the Index, our “live” P/E stands to exceed 60x! Pardon the drama, but that is stock market suicide. Especially as at this writing, the yield on the “riskless” Bond is 1.676% vs. that on the “risk unlimited” S&P only being 1.532% Uh-ohhh… And should the S&P halve itself, ‘twould still by lack of substantive earnings be expensive.
So there 'tis. Plus, as herein penned and graphically depicted (per last week's missive) of Gold's rise into year-end over recent years, 'tis thus far again playing out. Moreover, just in time for Santa's sleigh ride 'round the world. For as we go to Gold's weekly bars from a year ago-to-date, in settling out yesterday (Friday) at 1887, price is now well within range to take out the overhead descending red dots of parabolic Short trend so as to flip 'em Long in the ensuing week. (That of course barring a bunch of Short Scrooges hitting underlying bids to make it all go wrong). But the point is: with Gold at 1887, the flip price as depicted at 1925, and our "expected weekly trading range" now at 77 points, the 38-point run up to eclipse the red dots is well within range. "Now, Dasher! Now, Dancer! And the balance of you bunch! Let's DO this!" (A little poetic license, there):
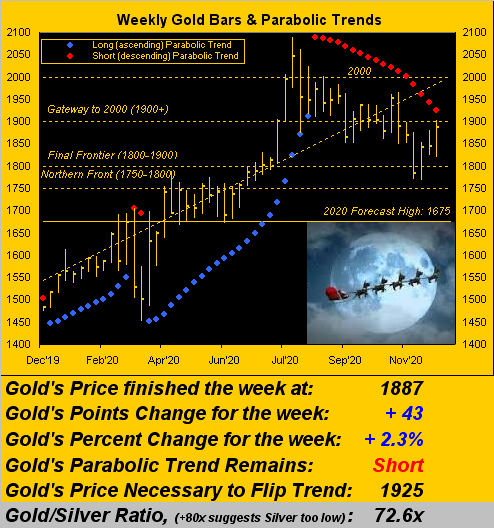
As for you dot counters scoring at home, the duration of the above red dots is now 17 weeks, ranking it fifth amongst the 42 parabolic Short trends millennium-to-date. For the other prior four of more Short duration, once they flipped to Long, the additional upside Gold points gained were +126 (after 20 Jan '12), +181 (after 17 Aug '12), +35 (after 31 May '13) and +148 (after 07 Sep '18). So from the "Fun With Numbers Dept." were the current parabolic Short trend flip to Long at the noted 1925 price and the average points gain following those four other occurrences ensure, the rise would be +122 points to 2047 ... sufficiently near the All-Time High of 2089 that 2100+ would be just fine. What's in your hearth stocking?
Speaking of stock, the market of such obliviously keeps rising, the S&P 500 recording its own all-time high on Friday at 3727. That's carrying an obscenely high "live" price/earnings ratio of 45.8x. Oh but wait there so much more! The big four-wheel battery company Tesla (TSLA) goes into the S&P 500 on Monday, so we can update that ... now hang on, let's see ... the stock is $695/share of which outstanding are 947.9 million and the trailing 12-months EPS is 57¢ which puts its P/E at 1,227.5x and by capitalization weighting 'twill rank fifth amongst all 505 S&P constituents with a 2.021% share of the Index ... and WOW: that puts the P/E of the entire S&P up to 69.7x! Cue the late, great sportscaster Bullet Bill King: "Holy Toledo!" (Stock market suicide, indeed).
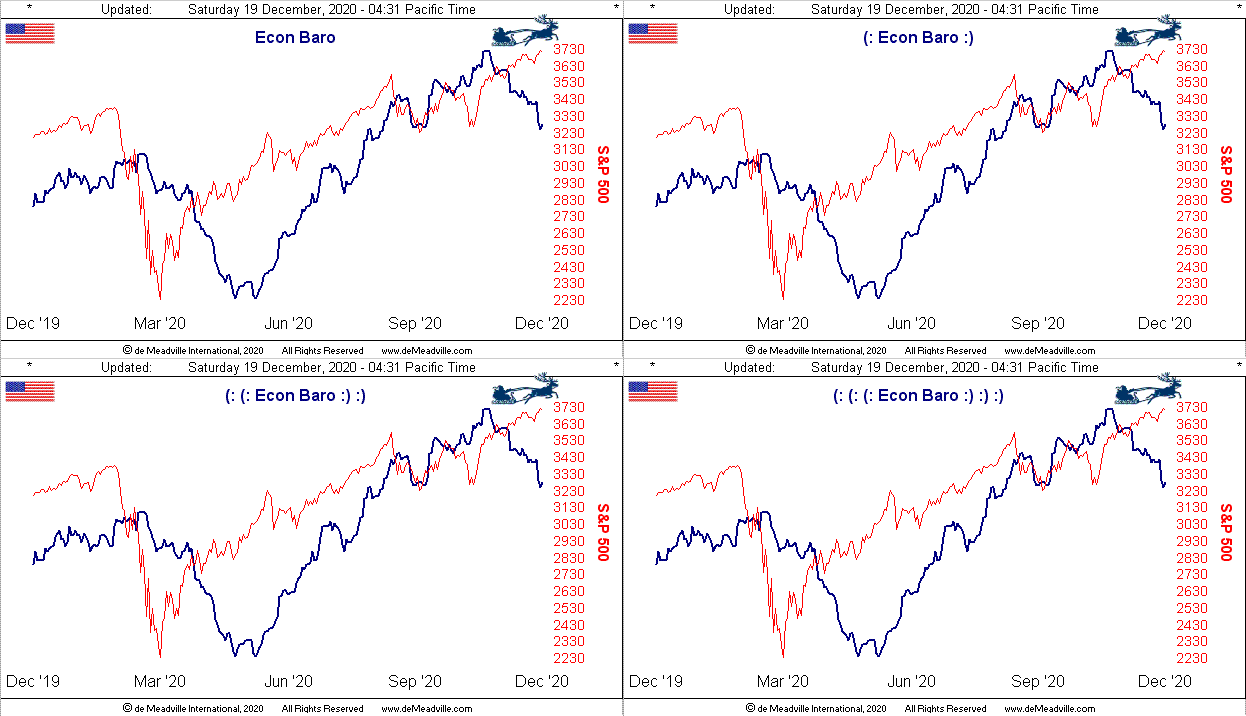
Further, taking stock of the Economic Barometer finds it in full plunge of late, And let's face it, 'tis hard to maintain the torrid pace of the Baro's recovery in climbing out from COVID. 'Course the stock market per the red line of the S&P 500 could care less about the economy, just as it does not about earnings. (But let's not through cold water upon Santa's annual rally, lest his sleigh rudders freeze). Nonetheless, incoming Baro metrics this past week found lower levels for December in each of the New York Empire State, Philly Fed and National Association of Home Builders readings, as well as slowing in both November's Industrial Production and Leading Indicators, and outright shrinkage for the month's Retail Sales. Thus the Baro as it currently fails:
But fear not, for riding in on its own steed is the Federal Reserve Bank, its Open Market Committee wrapping up their final meeting for this year with plans to provide "open-ended stimulus" as the 21st century's third decade is about to commence. Further, zero interest rates are foreseen for some three years forward. That would be a neat trick to maintain as there are glimmers of inflation gain: all that currency debasement is seeing our BEGOS Markets ever-rising of late, notably Oil, Copper, the S&P, the Swiss Franc and rather dubiously the Euro, (which at some point shall face its own "oh-nooo..." per that which we wrote a week ago):
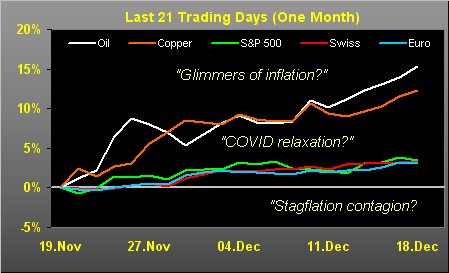
So up with prices, down with economies and voilà comes the stagflation contagion. "Got Gold?" Add to which the public sector woes that our States don't have the billions (so they say) of dough necessary to get COVID vaccines to the people. What's so pricey about going to Dr. Plotz to get yer shots? (Beyond our pay grade to analyze).
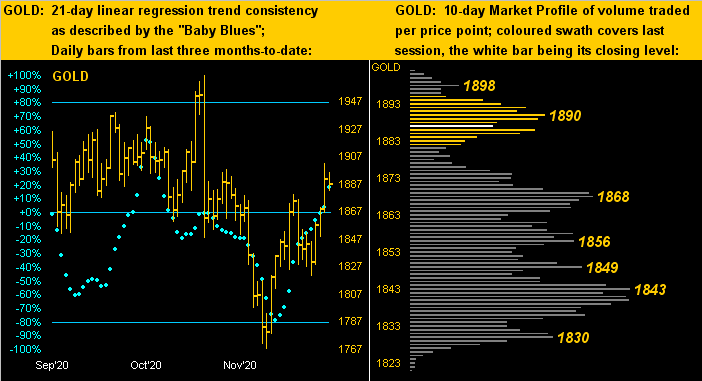
But 'tis the analysis of Gold for you to behold as we go our two-panel view of price's daily bars from three months ago-to-date on the left and 10-day Market Profile on the right. And commensurate with Gold's rise out from the 1700s three weeks ago, we see the baby blue dots of linear regression trend consistency breaking above their 0% axis. Should Gold soon flip its aforeshown weekly parabolic trend from Short to Long, clearly the 1900s shall be back in play as doth our title sway. As for the Profile, quite the thicket of trading support has now been built into the mid-1800s, which puts us in mind of the time-honoured traders' quip that "if it can't down go then it's gonna go up":
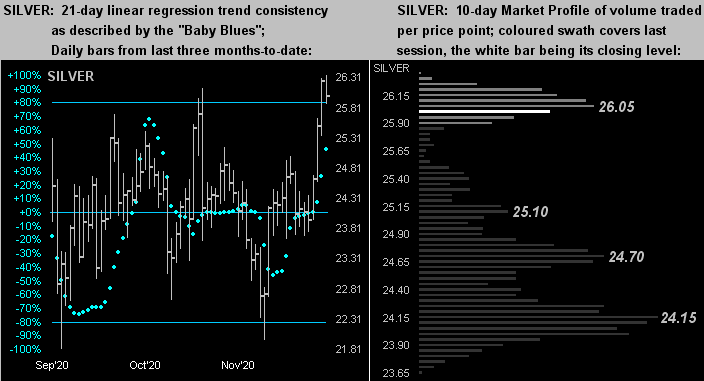
The analysis by the same dual graphic is similar for Sister Silver, whose "Baby Blues" (at left) are in nice upward acceleration, whilst in her Profile (at right) the 24s appear safe with the current hump 'round 26 the key level over which to get. With the Gold/Silver ratio at 72.6x, should the yellow metal achieve that parabolic penetration at 1925 and from which pop those averaged points up to 2049 (per the above "Fun With Numbers Dept." assessment), we'd likely find the white metal back up into the 28s:
We thus continue to be pretty bulled-up 'bout Gold; indeed we've no reason for it to be sold. Bits**t of course is going bonkers, but its swing risk is so ferocious that we shan't touch that bit a wit. Comes to mind the phrase about "making a lot out of nothing", quite literally. Being very conservative when it comes to futures trading, our emphasis these many years on "cash management being more important than market direction" wouldn't fare well in the cul-de-sac of cryptocrap: $23,000 today, then $400K en route to $1M one day ... and suddenly $0, ok? No, thank you. We'll simply stick to archaic old Gold, for which Santa brings us a 1900+ load!