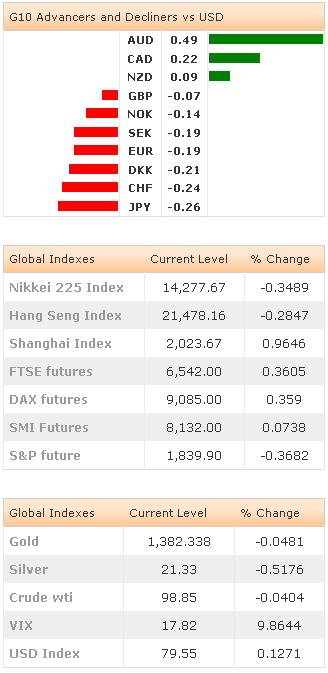
Market Brief
The week starts with high tensions in Ukraine due to the Crimea referendum, where 93% of voters expressed their will to join Russia. The US and the EU rejected the outcome, claiming that referendum is “illegal” and will announce sanctions as soon as today. In Russia, the parliament will vote on legislation changes to include Crimea into the Russian Federation on Friday.
In China, the PBOC announced the widening of Yuan’s trading band form 1% to 2%. USD/CNY picked up momentum and extended gains to 6.1708 (a stone’s throw lower than Feb 28th high of 6.1760), USD/CNH advanced to 6.1722, highest since May 2013. CNY mostly traded above 1.000 versus CNH, hit 1.0047 for the first time in almost a year.
The Aussie complex traded higher on Chinese news. AUD/USD rallied to 0.9063 in Sydney. Trend and momentum indicators are flat, MACD(12,26) will remain in the green zone for a daily close above 0.9033. The key short-term resistance stands at 0.9080 (Fibonacci 38.2% on Oct’13 – Jan’14 drop). Option bids abound at 0.9050/0.9100/0.9125. AUD/NZD recovered to 1.0606, the bias is clearly on the downside with key support placed at 1.0493 (Jan low).

JPY crosses are better bid. AUD/JPY tests the 21-dma (0.92131) on the upside, while USD/JPY advanced to 101.67 in Tokyo. Last week’s sell-off turned the technical picture bearish in USD/JPY. The pair is likely to remain under selling pressure with option barriers trailing below 101.85. Stops are seen above 102.00, to be capped by a new set of option offers pre-102.35 (appr. 21-dma). The key support stands at 100.76 (February low).
EUR/USD opened the week at 1.3903 and remained ranged between 1.3891/1.3914 in Asia. The tensions in Ukraine are likely to keep EUR in demand versus its CEE peers. The sentiment remains on the upside pre-CPI figures (due at 10:00 GMT). Trend and momentum indicators are comfortably bullish, eyes are set to 1.4000 (Jan-Mar uptrend channel top). On the downside, the first line of support is placed at 1.3800/25 (optionality / March 1st high). EURGBP trades in the bullish consolidation zone; the 21-dma (0.82720) tests the 50 dma (0.82682) on the upside suggesting the extension of gains to 0.83915 (Fibonacci 61.8% on Aug’13- Feb’14 decline).
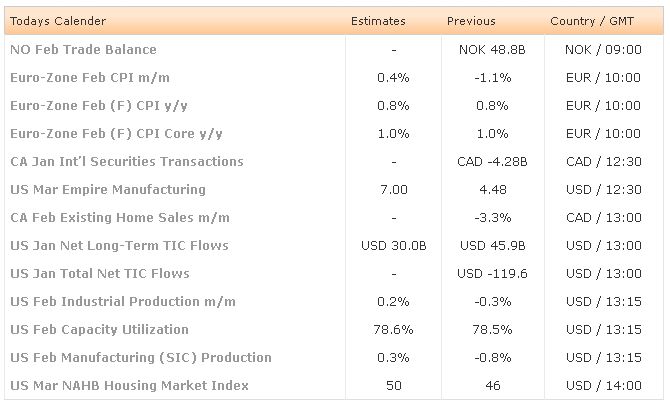
This Monday, traders watch Norwegian February Trade Balance, Euro-Zone February (Final) CPI m/m & y/y, Canadian January International Securities Transactions, US March Empire Manufacturing, Canadian February Existing Home sales m/m, US January Net Long-Term TIC Flows and Total Net TIC Flows, US February Industrial Production m/m & Capacity Utilization, US February Manufacturing (SIC) Production and US March NAHB Housing Market Index.

Currency Tech
EUR/USD
R 2: 1.4000
R 1: 1.3967
CURRENT: 1.3886
S 1: 1.3825
S 2: 1.3773
GBP/USD
R 2: 1.6785
R 1: 1.6710
CURRENT: 1.6633
S 1: 1.6585
S 2: 1.6540
USD/JPY
R 2: 102.35
R 1: 101.85
CURRENT: 101.61
S 1: 101.20
S 2: 100.76
USD/CHF
R 2: 0.8930
R 1: 0.8815
CURRENT: 0.8745
S 1: 0.8700
S 2: 0.8640
