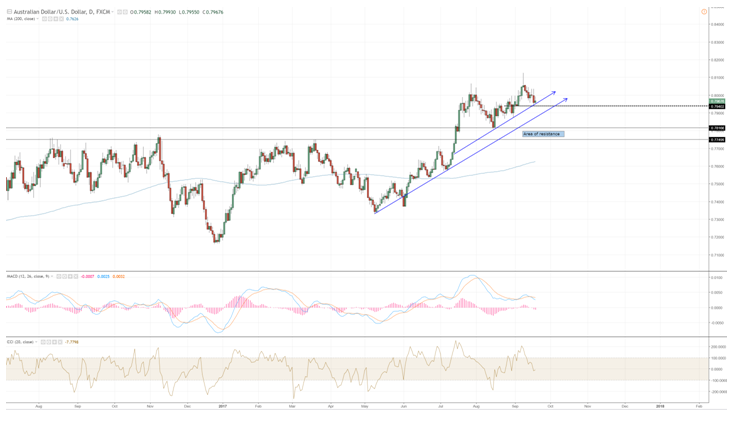
The Australian dollar has consolidated around the current technical level though it is clearly still holding within an upward trend. A mid-strength support level is at ~0.794 while more substantial support can be found between ~7745 and ~78166. A dip below this level would open the possibility of further depreciation. Moreover, to cancel the current upward bias, the price would need to fall below two upward trend lines as defined by the blue arrows in the chart below.
The currency does not seem to be oversold or overbought by any indicator and this leaves room for the possibility that further gains may be possible in the near term. Looking at the MACD, we see the price consolidating but with the signal lines crossing over in the last few days, a dip is also on the cards. A likely scenario is that the price will continue to consolidate for a few more days as both upward and downward pressure exists. An important decider of future direction may lie with the FOMC meeting on Wednesday.
An announcement that the Fed will cease reinvesting the proceeds of QE bond purchases, may reduce liquidity and drive up demand for the USD. On the other hand, commodity prices may continue to firm, pushing up demand for commodity currencies. Further positive Australian economic data will also be a boom for the aussie.

The Indian rupee (INR) has been consolidating since May as the market assesses the impact of Narendra Modi’s new currency changes, though it remains the best performing emerging currency market this year. Indeed, the INR has advanced on US dollar weakness produced by meteorological events and poor economic data.
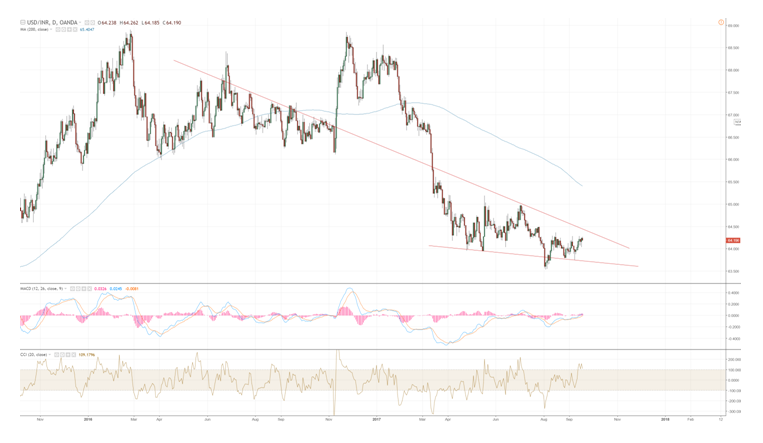
On the chart, the USD looks like it is carving a bottom, though whether this translates to further gains is yet to be revealed. Like the AUD, the FOMC meeting will determine the direction of the pair in the near term. Overseas flows are appreciating the value of the rupee and overall the Indian economy is improving. Another important decision will be the RBI interest rate decision on the 4th of October.
Examining the USD/INR chart further, we can see that a support line has formed though any advance may be capped by a rough resistance line in play since July last year. The Commodity Currency Index technical indicator says that the price is currently overvalued so there may be a pull back if the currency is to push higher above that resistance. Nevertheless, the trend is certainly still down. As with the AUD, there are multiple indications that the price will continue to stabilise in the near term. The Indian reserve bank decision may be the catalyst for subsequent currency behaviour.

