
T2108 Status: 17.1% (first day at oversold)
T2107 Status: 23.1%
VIX Status: 24.4
General (Short-term) Trading Call: bullish
Active T2108 periods: Day #1 under 20% (ending 48 days above 20%) (first day of the oversold period), Day #2 under 30% (underperiod), Day #5 under 40%, Day #7 below 50%, Day #22 under 60%, Day #363 under 70%
Commentary
T2108, the percentage of stocks trading above their respective 40-day moving averages (DMAs), triggers an oversold trading condition when it falls below 20%. Oversold signifies that odds favor a bounce (upside) because sellers have exhausted themselves for the time-being.
T2108 last closed in oversold territory on October 1, 2015. The lift-off from there was nearly breathtaking: October ended with a historic gain. By the end of October, the S&P 500 was up 8.1% from that last oversold close. I do not think a similar rush awaits the resolution of this latest run at oversold trading conditions. Given the deteriorating technicals going into this oversold period – chronicled over and over again in previous days and weeks – I think trading conditions are actually even more dangerous than they were during the August Angst. At that time, I confidently proclaimed an epic buying opportunity. For recent examples of the warnings, see December 2nd’s “A Notable Market Setback” and/or December 9th’s “A Mild Down Day Hides Expanded Market Weakness.”
T2108 closed the week at 17.1%. The August Angst first closed in oversold territory on Friday, August 21 at 18.1%. The S&P 500 (SPDR S&P 500 (N:SPY)) fell that day by 3.2% to 1970.89 as it delivered a follow-through to the previous day’s violent breakdown from 200DMA support. With angst building up over the weekend, the next trading day delivered up a flash crash. This time around, the S&P 500 fell 1.9% to 2012.37 to confirm a breakdown from 50DMA support that followed right on the heels of a 200DMA breakdown. We can only brace for what Monday brings THIS time!

The S&P 500 (SPY) is back in the danger zone as it decisively trades below 50 and 200DMA lines of support.
Astute traders will notice a particularly dangerous pattern that has developed in the S&P 500: a potential double-top. The double-top is messy but it is reinforced by the index’s stubborn insistence on trading just below the last all-time closing high set in May for three months until all heck broke loose in the August Angst. The rally off the subsequent W-bottom and oversold trading conditions decisively ended just short of the all-time high…twice, both times in November. So, the stock market is oversold but dangerous: sure it should bounce from round current levels, but the upside prospects are limited. I even doubt the S&P 500 will break what is now resistance at the 50 and 200DMAs anytime soon.
At this point, traders should assume the current selling and breakdown below critical support signals a confirmation of a top until buyers prove otherwise. In other words, the market is guilty until proven innocent because of all the tremendous resistance that has built up since the all-time high in May on top of multiple convincing failures of 50 and 200DMA support. A retest of that W-bottom seems a near lock in the coming weeks or months. Again, because December is typically a mild month when it comes to maximum drawdowns, I am assuminga massive plunge is not in the cards for this month, even with the Federal Reserve’s huge decision on monetary policy coming on December 16th.
T2108 spent 48 trading days above 20%. During this roundtrip back to oversold conditions, the S&P 500 gained a decent 3.1%. The chart below shows this performance is well above expectations compared to similar runs since 1986.
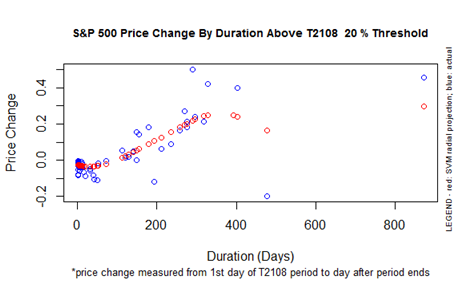
S&P 500 historical performance during the T2108 20% overperiod.
This is surprisingly strong performance and is one sliver of light for the market. Traders following the conservative T2108 trading strategy have thus achieved modest success. The conservative T2108 trading strategy triggers a buy only after the oversold period ends. The 3.1% gain does not take into account previous trades and still pales in comparison to the gains from aggressively trading the last oversold periods.
Given my assessment of increasing danger in the market, I will not trade the current oversold period as aggressively as I typically would do. The current selling is not deep enough with overhead resistance looming. I will still be looking to fade any large spikes in volatility. I am particularly getting ready to fade volatility going into or immediately after the Fed announcement on monetary policy. Going into this assessment, I did automatically execute my oversold trading rules. As a result I find myself sitting on two tranches of shares in ProShares Short VIX Short-Term Futures (SVXY). A low-ball bid on ProShares Ultra S&P500 (N:SSO) call options even executed.
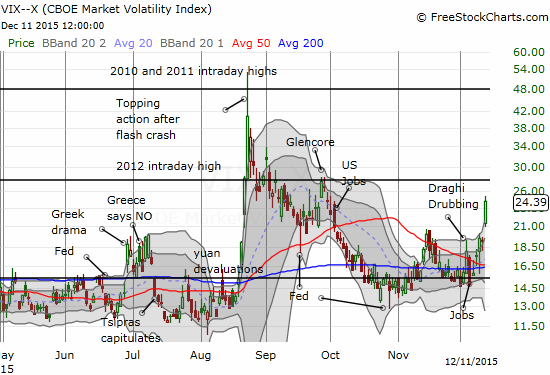
The volatility index, the VIX, is on the move again. It is elevated and likely to go higher going into the Fed meeting as angst increases over rate hikes.
T2107, the percentage of stocks trading above their respective 200DMAs, is adding to the sense of danger. When T2108 first went oversold during the August Angst, T2107 closed at 25.5%. This time around oversold starts with T2107 at 23.1% – a slight, yet, notable slippage in technical health for the market. Moreover, T2107 never quite reversed all the losses incurred during the August Angst. In other words, the longer term outlook for the market remains questionable.
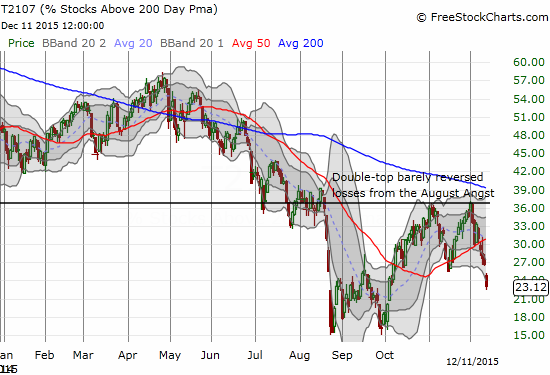
T2107 continues to struggle and exposes a questionable longer-term outlook for the market.
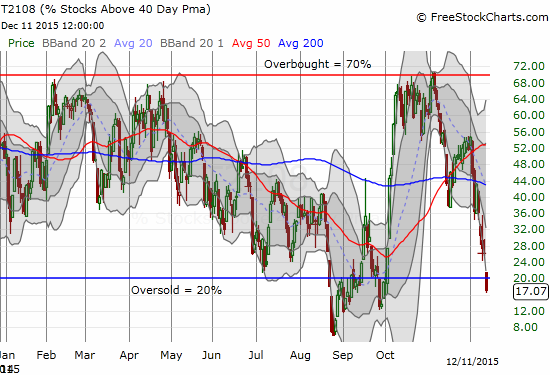
T2108 failed to punch through overbought levels after the last bounce from oversold conditions. As I suspected at the time, this failure exposed market weakness. Along the way, it helped identified an unhealthy lack of breadth in the market even as the S&P 500 tried to hang in there.
On the bearish side, I DID change things up a bit. Soon after the open, I went after Splunk (SPLK) with put options. The gap down looked like a confirmed 50DMA breakdown. As selling picked up on the day, I was able to lock in more than a double on this position.
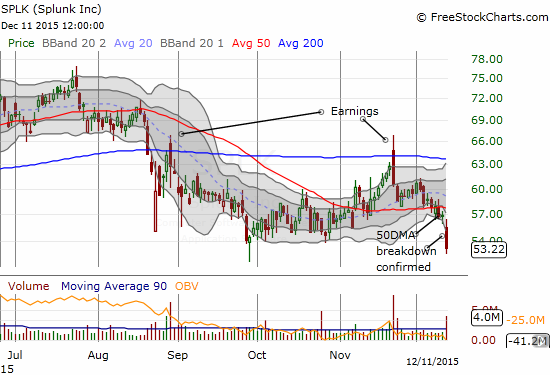
Splunk (SPLK) confirms a 50MDA breakdown on heavy selling.
Next up was SPDR Barclays (L:BARC) High Yield Bond ETF (JNK).
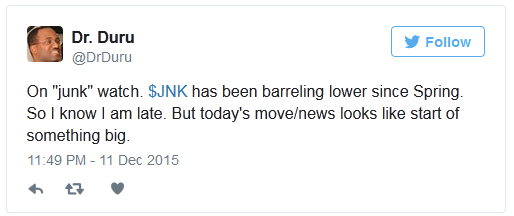
In case you somehow missed the news, here is a summary from Reuters in “Third Avenue to liquidate junk bond fund that bet big on illiquid assets“:
“New York-based Third Avenue Management is blocking investors from withdrawing their money from a near $1 billion junk bond fund as it tries to liquidate the fund in the biggest failure in the U.S. mutual fund industry since the Primary Reserve Fund “broke the buck” during the 2008 financial crisis
The demise of the fund is sure to renew fears that less liquidity in the corporate bond market will cause more volatility, especially as the Federal Reserve leans toward raising interest rates next week for the first time in a decade.”
Liquidity is the life blood of the market. A rush to get out the market when the Fed is moving to get incrementally less accommodative to financial markets adds yet more danger to trading conditions. That danger gets amplified when sellers cannot find buyers. Despite being late to the decline in JNK, put options here look like one of the better market hedges around right now. At least one other trader though like me as volume surged on the fistful of January $32 put options that I bought.
SPDR Barclays High Yield Bond ETF (JNK) experiences a high-volume gap down for the second time in 4 trading days.
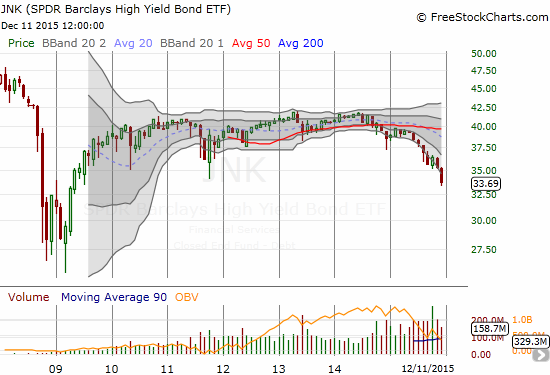
SPDR Barclays High Yield Bond ETF (JNK) has been in decline since the summer of 2014…around the time oil and other commodities began the current phase of the collapse in commodity prices.
I drew the parallel on the monthly chart because I suspect that a decline in liquidity in the junk bond market is connected to the accelerated collapse in commodity prices. The appetite and capacity for risk must be dropping. Yet more danger for the market even as the market first faces the prospects for an oversold bounce.
My JNK put options effectively replace my short on Goldman Sachs (N:GS). I covered this position according to my T2108 oversold trading rules that requires scaling back on bearish positions. GS is also now well below its lower-Bollinger Band and likely itching to bounce back. Depending on market conditions, I may consider shorting GS again on a retest of 50DMA resistance.
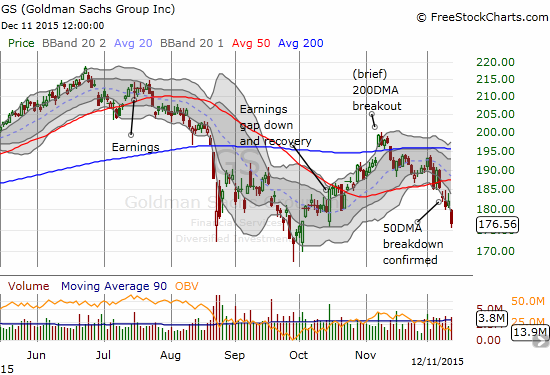
Goldman Sachs (GS) continues to break down after what was an impressive breakout above 200DMA resistance in early November.
The woes for GS are important because market conventional wisdom has insisted that financial firms like GS will benefit from higher rates from the Fed.
The currency markets provide a final confirmation of the increasing danger.
The Australian dollar (FXA) versus the Japanese yen (FXY), AUD/JPY, is my favorite proxy for the market’s appetite for risk. At the time of writing, AUD/JPY confirmed Friday’s critical breakdown from 50DMA support. ‘Nuff said.
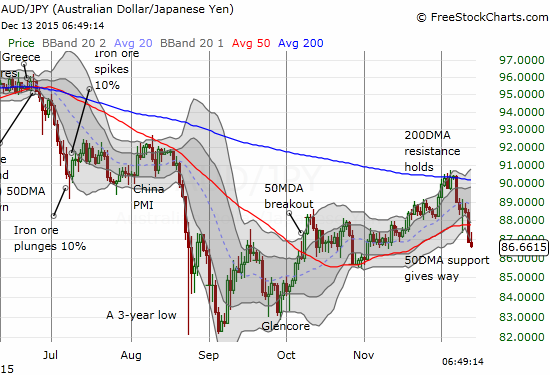
AUD/JPY breaks down and confirms stiff resistance at the downtrending 200DMA.
I offer this final set of charts for consideration with commentary in the captions…
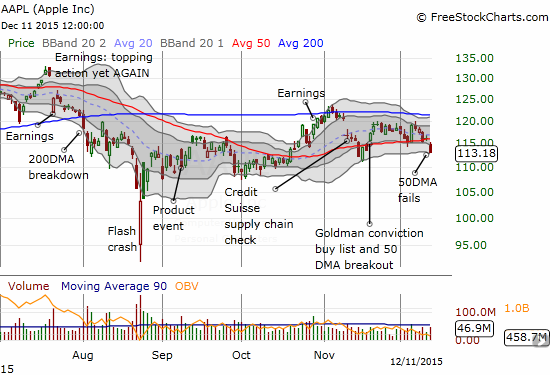
Apple (O:AAPL) breaks down below its 50DMA again. Danger…
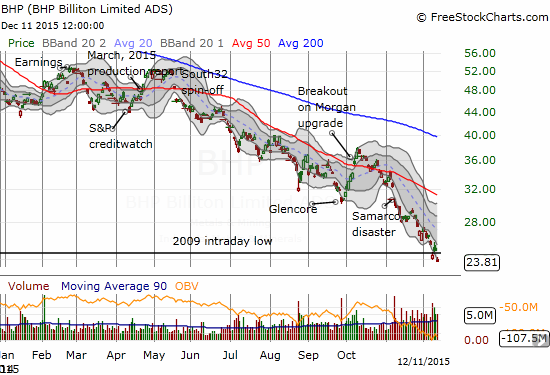
BHP Billiton (L:BLT) Limited (BHP) closes at a fresh 10-year or so low as the commodities collapse continues apace.
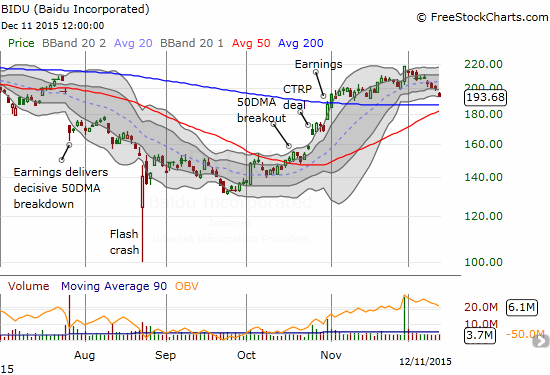
Baidu (BIDU) has reversed a big pop and breakout on November 30th. A critical test of support looms at converging 50 and 200DMAs.
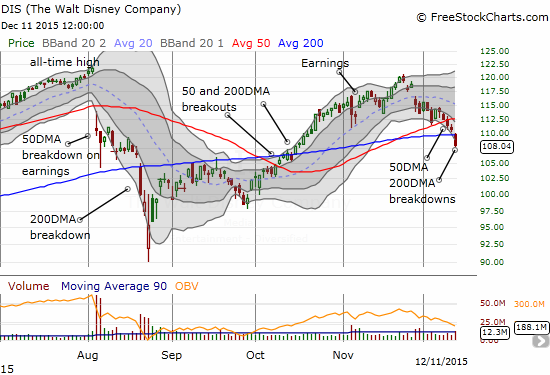
Disney (DIS) confirms a 50DMA breakdown with a 200DMA breakdown. Danger…
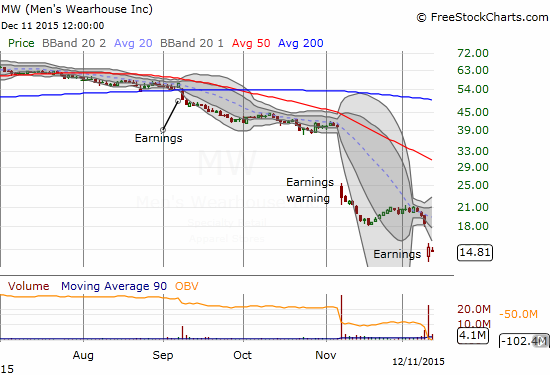
Men’s Warehouse (MW) continues its collapse. It now sits at levels last seen in early 2009.
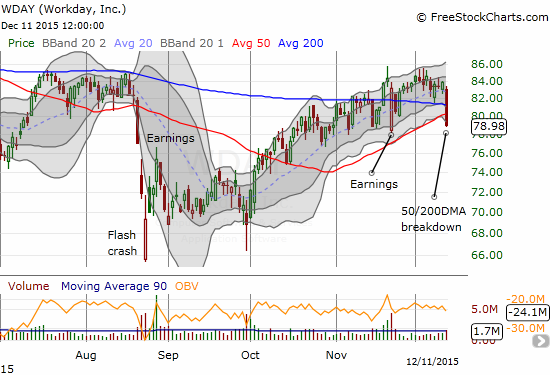
Workday (WDAY) ends a slow churn upward from October lows with a big 5.8% breakdown below support that was converging with the 50 and 200DMAs.
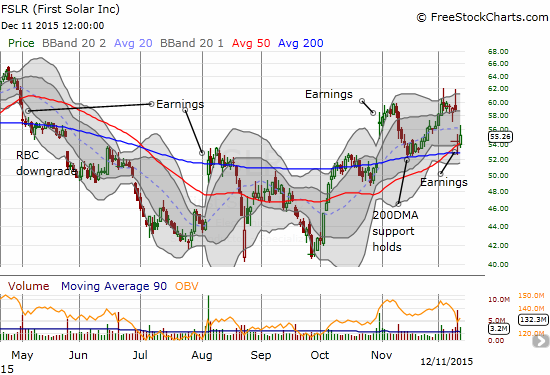
First Solar (O:FSLR) gapped down post-earnings but delivered a tradeable bounce. I flipped call options through this move as I continue active scouting for bullish entry points in solar stocks. Note how FSLR held 200DMA and then 50DMA support.
Daily T2108 vs the S&P 500 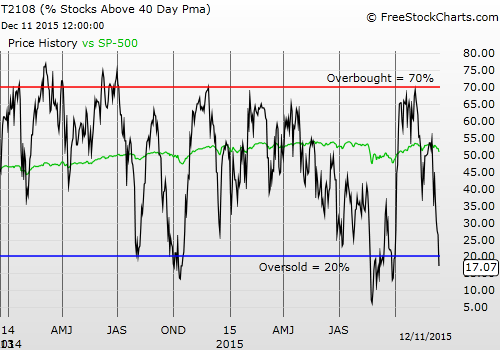
Black line: T2108 (measured on the right); Green line: S&P 500 (for comparative purposes)
Red line: T2108 Overbought (70%); Blue line: T2108 Oversold (20%)
Weekly T2108 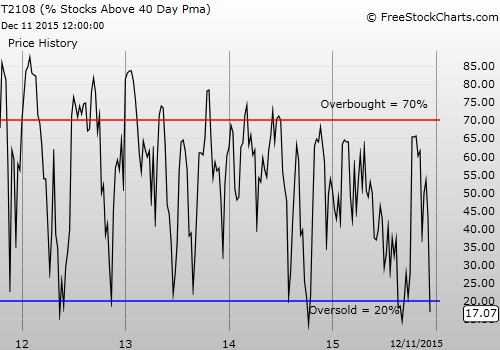
*All charts created using freestockcharts.comunless otherwise stated
Be careful out there!
Full disclosure: long SVXY shares, long SSO call options, net short of the Australian dollar, net long the Japanese yen, long JNK put options