Overseas Shipholding Group, Inc. is a tanker company engaged primarily in the ocean transportation of crude oil and petroleum products. As of December 31, 2010, it owned or operated a modern fleet of 111 vessels (aggregating 11.3 million deadweight tons and 864,800 cubic meters) of which 88 vessels operated in the international market and 23 operated in the U.S. Flag market.
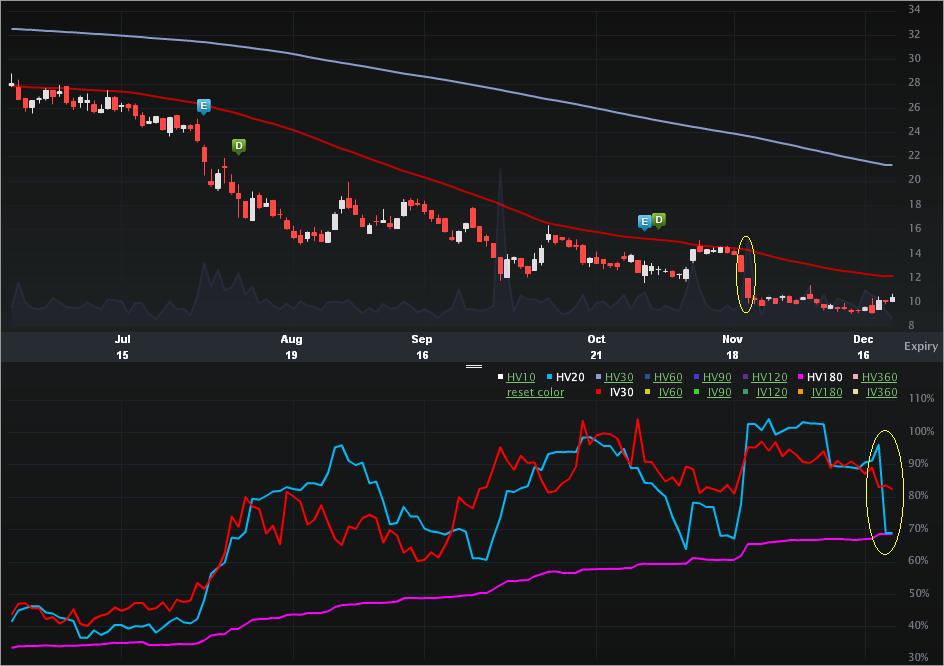
This is a vol note with detailed comp analysis to coincide with some levels in the stock price. Let’s start with the Charts Tab (6 months), below, and then some news. The top portion is the stock price, the bottom is the vol (IV30™ - red vs HV20 - blue vs HV180 - pink).
A bunch of stuff going on here.
1. The stock has been headed down for quite some time. Six months ago (6-22-2011) the stock closed at $28.06. As of this writing and the $10.47 print, the stock is down 63%. A year ago (not pictured), the stock closed at $35.51 – down 71% YTD.
2. On 11-18-2011 the stock closed at $13.99. Four calendar days later, the stock closed at $10.40. Here’s the news surrounding that abrupt drop:
Shipping company Frontline (FRO) said today that it might run out of money by early next year if the market doesn’t rebound, sending a ripple of fear through the entire industry. The company said that there are too many shipping vessels available now and not enough global demand for oil. Shares fell 41%.
“[W]ith the continued weak markets, we see ourselves in a very difficult situation,” said CEO Jens Martin Jensen on the company’s earnings call.
Source: Barron’s via Yahoo! Finance: Shipping Stocks Plunge After Frontline Report, written by Avi Salzman.
For the record and the intellectually obsessive, FRO stock is down 85% YTD from $25.68 to now $3.84. Note however, that the stock drop for that period was entirely based on correlation / industry wide risk -- not company specific risk.
3. On the vol side, the consistent and large stock slide has catapulted the long-term trending HV180 (the long-term historical realized vol) from 33.47% to now 68.56%. In English, the stock's realized volatility has more than doubled over the last six months.
4. Since the Novemeber news from FRO, OSG hasn’t recovered, but it has found a sort of quiet period – no major moves up or down. That means the HV20 has dipped substantially since that period has rolled off of the 20-trading day average. In English, the blue-line has fallen dramatically over the last two days to almost exactly the long-term trend (HV180).
5. With #4 in mind, check out the action in the implied (red-line). Basically the IV30™ has been steadily dropping but not nearly as much as the short-term realized movement of the stock. This has created a fairly large vol diff between the implied and the two historical realized vol measures. Again, in English, the option market now reflects substantially more risk in the future than OSG has demonstrated in the last (past) trading month.
Specifically:
IV30™: 82.40
HV20: 68.87
HV180: 68.56
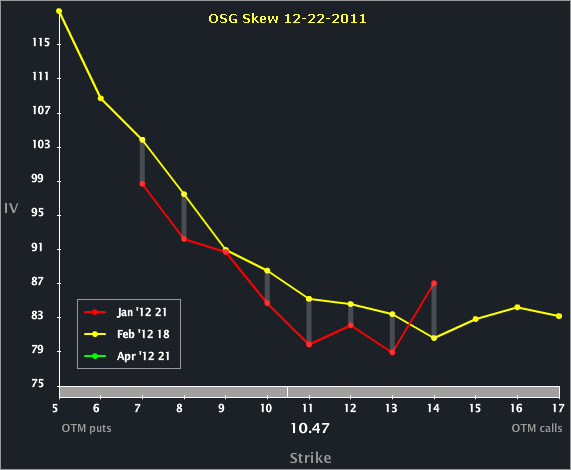
Let’s turn to the Skew Tab, below, to examine the month-to-month and line-by-line vols..
We can see that the Jan ATM options are priced below the Feb (in terms of vol). That’s interesting b/c while the IV30™ is drawn mostly from Jan at this point and is elevated to the historical realized measures, the Feb options are even more elevated. The last earnings cycle for OSG in Feb was 2-28-2011 so it’s reasonable to assume that the next earnings report will be after Feb expo. Said differently, the Feb elevated vol to Jan is likely not related to an earnings release but rather a reflection of the Dec doldrums.
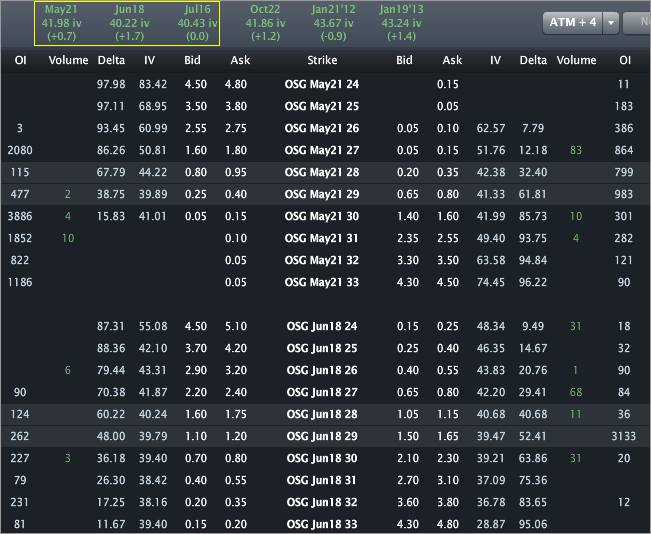
Finally, let’s turn to the Options Tab for completeness.
We can see that Apr is priced above Feb (in vol terms) – that’s likely the earnings event that will fall in the Mar expiry. For the record, the next earnings release for FRO is likely in late Feb as the last two earnings dates have been 2-26-2010 and 2-28-2011.
I wrote about this one for TheStreet.com (OptionsProfits), so no specific trade analysis here. I will say that the the 52 wk range in OSG stock price is [$9.05, $36.35] and the same range in IV30™ is [29.71%, 104.15%]. So, the vol looks juicy, but isn't at an annual high, so the risk reflected doesn't scream "extreme." Of course, that doesn't predict the future with any certainty.
This is trade analysis, not a recommendation.
- English (UK)
- English (India)
- English (Canada)
- English (Australia)
- English (South Africa)
- English (Philippines)
- English (Nigeria)
- Deutsch
- Español (España)
- Español (México)
- Français
- Italiano
- Nederlands
- Português (Portugal)
- Polski
- Português (Brasil)
- Русский
- Türkçe
- العربية
- Ελληνικά
- Svenska
- Suomi
- עברית
- 日本語
- 한국어
- 简体中文
- 繁體中文
- Bahasa Indonesia
- Bahasa Melayu
- ไทย
- Tiếng Việt
- हिंदी
Overseas Shipholding (OSG) - Elevated Vol, Correlation Risk, Detailed Vol Analysis -- Implied to Historical Comps
Published 12/23/2011, 03:48 AM
Updated 07/09/2023, 06:31 AM
Overseas Shipholding (OSG) - Elevated Vol, Correlation Risk, Detailed Vol Analysis -- Implied to Historical Comps
Overseas Shipholding (OSG) - Elevated Vol, Correlation Risk, Detailed Vol Analysis -- Implied to Historical Comps
Latest comments
Loading next article…
Install Our App
Risk Disclosure: Trading in financial instruments and/or cryptocurrencies involves high risks including the risk of losing some, or all, of your investment amount, and may not be suitable for all investors. Prices of cryptocurrencies are extremely volatile and may be affected by external factors such as financial, regulatory or political events. Trading on margin increases the financial risks.
Before deciding to trade in financial instrument or cryptocurrencies you should be fully informed of the risks and costs associated with trading the financial markets, carefully consider your investment objectives, level of experience, and risk appetite, and seek professional advice where needed.
Fusion Media would like to remind you that the data contained in this website is not necessarily real-time nor accurate. The data and prices on the website are not necessarily provided by any market or exchange, but may be provided by market makers, and so prices may not be accurate and may differ from the actual price at any given market, meaning prices are indicative and not appropriate for trading purposes. Fusion Media and any provider of the data contained in this website will not accept liability for any loss or damage as a result of your trading, or your reliance on the information contained within this website.
It is prohibited to use, store, reproduce, display, modify, transmit or distribute the data contained in this website without the explicit prior written permission of Fusion Media and/or the data provider. All intellectual property rights are reserved by the providers and/or the exchange providing the data contained in this website.
Fusion Media may be compensated by the advertisers that appear on the website, based on your interaction with the advertisements or advertisers.
© 2007-2024 - Fusion Media Limited. All Rights Reserved.
