Get 40% Off
👀 👁 🧿 All eyes on Biogen, up +4,56% after posting earnings. Our AI picked it in March 2024.
Which stocks will surge next?
Unlock AI-picked Stocks

Oscillators: The Basics Of RSI

Published 07/24/2017, 08:18 AM
Updated 02/02/2022, 05:40 AM

What is technical analysis?

The use of charts and the study of historical price movements to help predict future trends. By looking through prices, the goal is to determine patterns and past signals to try and identify the direction of future prices.

Every technical trader is looking at the same chart which helps solidify the trend through self-fulfilling prophesy.

How to determine a trend using the RSI curve

The relative strength index (RSI) tracks the ability of an instrument to close higher or lower over your selected time frame. When the RSI tips above 70, the asset is thought to be overbought. When the curve touches below 30, the instrument is considered ‘oversold’.

Indicators can read as either overbought or oversold for a long period of time therefore reaching these levels is not necessarily a signal that the trend will immediately reverse – when the curve crosses back from the 70/30 level, this is when there is a signal that the trend has reversed.

When the RSI moves back into the 70 – 30 zone after trading above or below these parameters, there can be a strong bullish or bearish movement as a result.
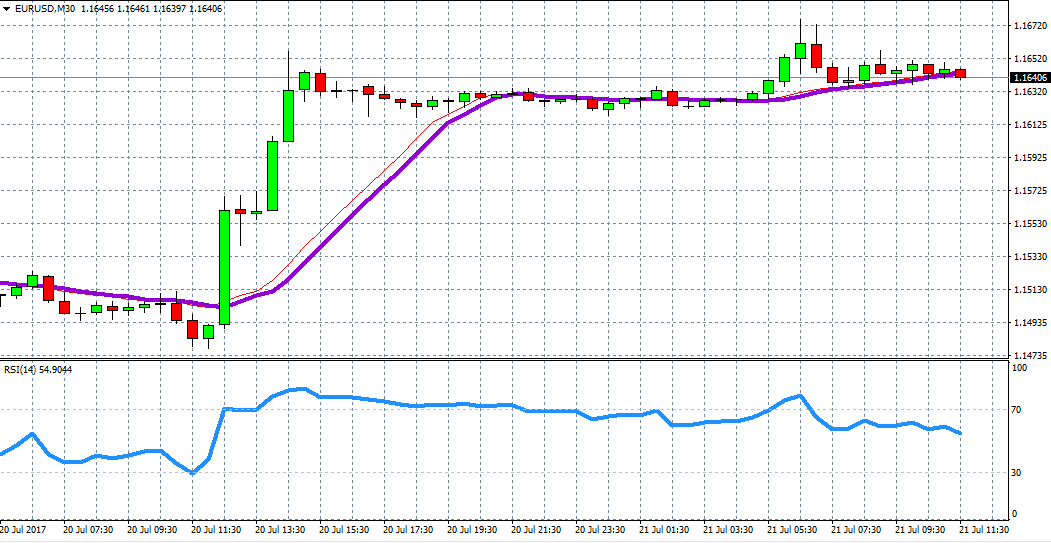
EUR/USD M30 Chart

Divergence occurs when the price of an asset makes a new high/low however the indicator fails to do so.

Bullish Divergence – When the price moves to new lows and the RSI stays at a higher low.

Bearish Divergence – When the price moves to new highs and the RSI stays at a lower high.

3rd party Ad. Not an offer or recommendation by Investing.com. See disclosure here or remove ads .

Latest comments

Risk Disclosure: Trading in financial instruments and/or cryptocurrencies involves high risks including the risk of losing some, or all, of your investment amount, and may not be suitable for all investors. Prices of cryptocurrencies are extremely volatile and may be affected by external factors such as financial, regulatory or political events. Trading on margin increases the financial risks.
Before deciding to trade in financial instrument or cryptocurrencies you should be fully informed of the risks and costs associated with trading the financial markets, carefully consider your investment objectives, level of experience, and risk appetite, and seek professional advice where needed.
Fusion Media would like to remind you that the data contained in this website is not necessarily real-time nor accurate. The data and prices on the website are not necessarily provided by any market or exchange, but may be provided by market makers, and so prices may not be accurate and may differ from the actual price at any given market, meaning prices are indicative and not appropriate for trading purposes. Fusion Media and any provider of the data contained in this website will not accept liability for any loss or damage as a result of your trading, or your reliance on the information contained within this website.
It is prohibited to use, store, reproduce, display, modify, transmit or distribute the data contained in this website without the explicit prior written permission of Fusion Media and/or the data provider. All intellectual property rights are reserved by the providers and/or the exchange providing the data contained in this website.
Fusion Media may be compensated by the advertisers that appear on the website, based on your interaction with the advertisements or advertisers.
© 2007-2024 - Fusion Media Limited. All Rights Reserved.