- Phase One: Positive Read: no fresh tariffs; Negative Read: priced in, hollow agreement
- Asian stocks enjoyed only a tepid rally; China underperformed
- Gold is flat, despite a weaker dollar and rising stocks
U.S. futures extended a rally, European stocks hit a fresh record, while Asian stocks were mixed, after the milestone signature on the first stage of a trade deal between the U.S. and China took markets to record highs. Haven assets the dollar, Treasurys, gold, the yen and bitcoin eased. Oil was little changed.
Contracts on all four major U.S. indices advanced. For large caps, this means underlying gauges are slated to open at prices never seen before, while small caps are set to start the session at the highest levels since September, within 3 percentage points below the Russell's record in September of 2018.
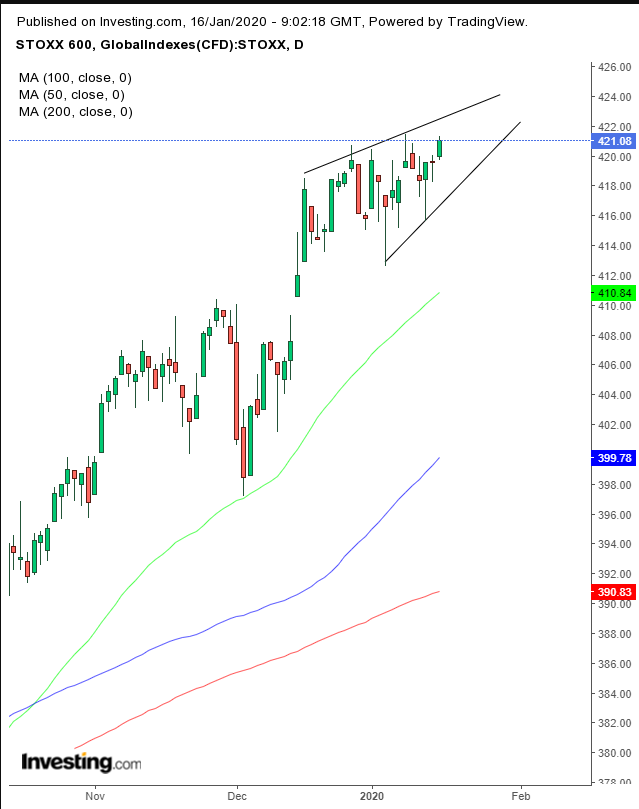
Taiwan Semiconductor Manufacturing (NYSE:TSM) obliterated expectations, pulling up the European tech industry, sending the STOXX Europe 600 Index to all-time highs. Technically, however, we advise caution due to a rising wedge pattern, which suggests that buyers may run out of patience after feeding a market that is not making any significant movement.
Most Asian stocks enjoyed a mild rally, while ironically China’s Shanghai Composite (-0.52%) was the worst performer. Was this profit-taking after the execution of positive news priced in or a warning for investors?
While equities are running on the good news that there will be no fresh tariffs this year, there is also the feeling that markets had already played that out and are seeking fresh catalysts to sustain the priciest stocks ever. Add to that a partial agreement that doesn’t solve the core issues, compounded by the U.S. moving to block sales to Huawei – and despite all the current exuberance, we can’t help but feel that risk is growing to the downside.
The U.S. sought to prolong the optimism, with Vice President Mike Pence saying that the two world economic superpowers are already discussing Phase Two.
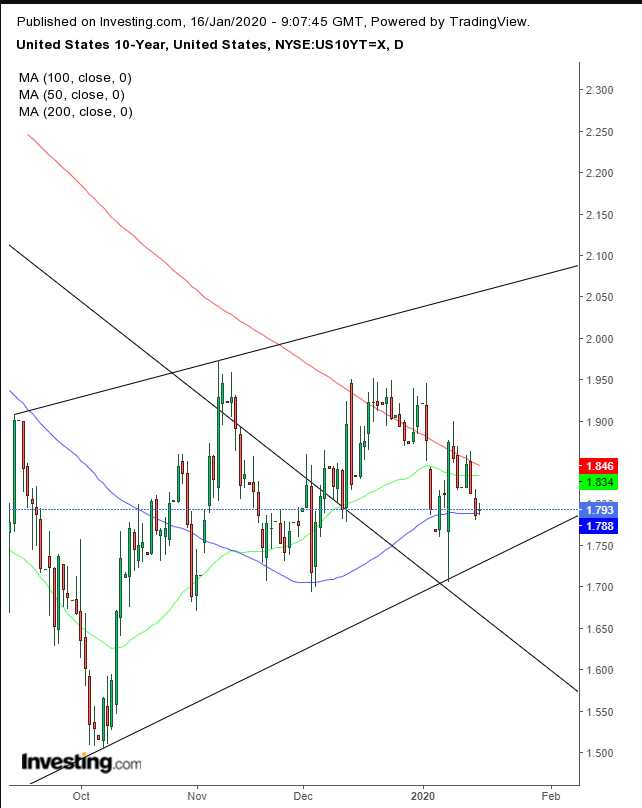
Yields rebounded, after finding support yesterday by the 100 DMA nearing the bottom of a rising channel – but still well below the 200 DMA – as the uptrend fights for freedom from the downtrend from the November 2018 top.
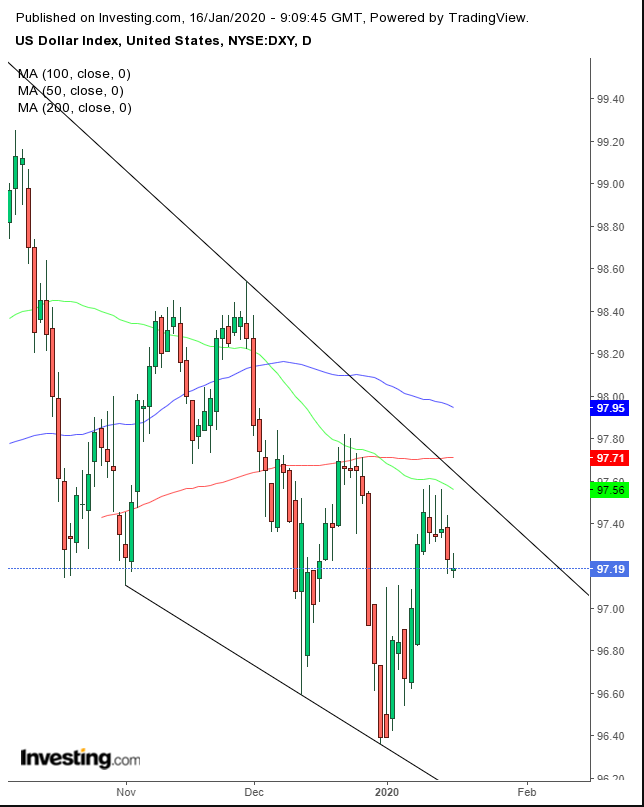
The dollar declined for the second day after failing for four straight days to penetrate the falling channel-top, “guarded” by the 50 DMA, after the MA fell below the 200 DMA amid the December drop, triggering the ominous Death Cross.
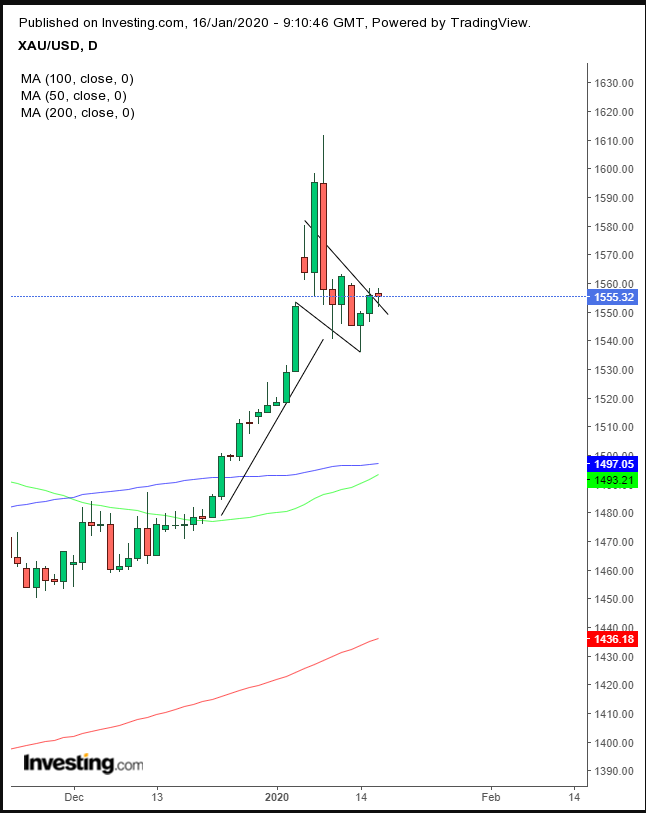
Gold was flat despite a weak dollar and rising equities, suggesting substantial hedging. Technically, the precious metal found support atop the bullish flag.
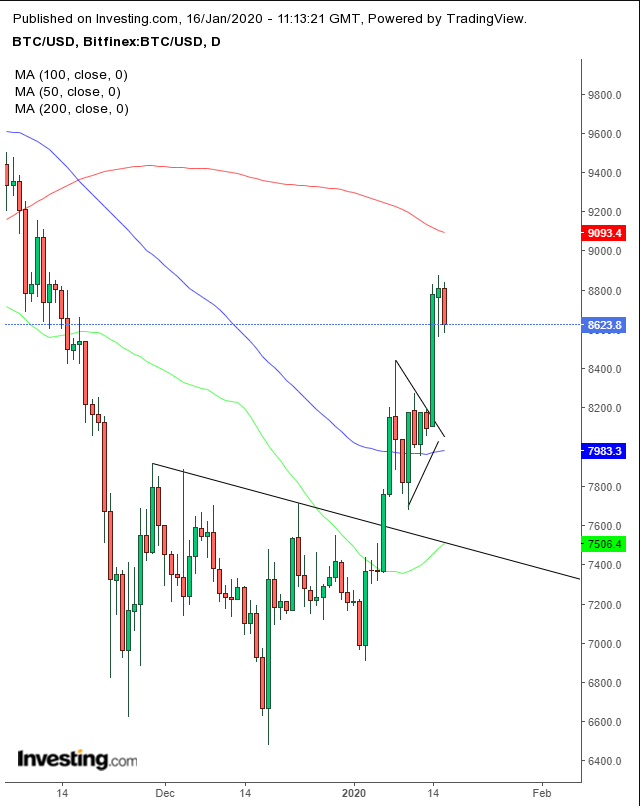
Bitcoin dropped along with havens, but the digital currency remains well above a completed bullish pennant atop a H&S bottom.
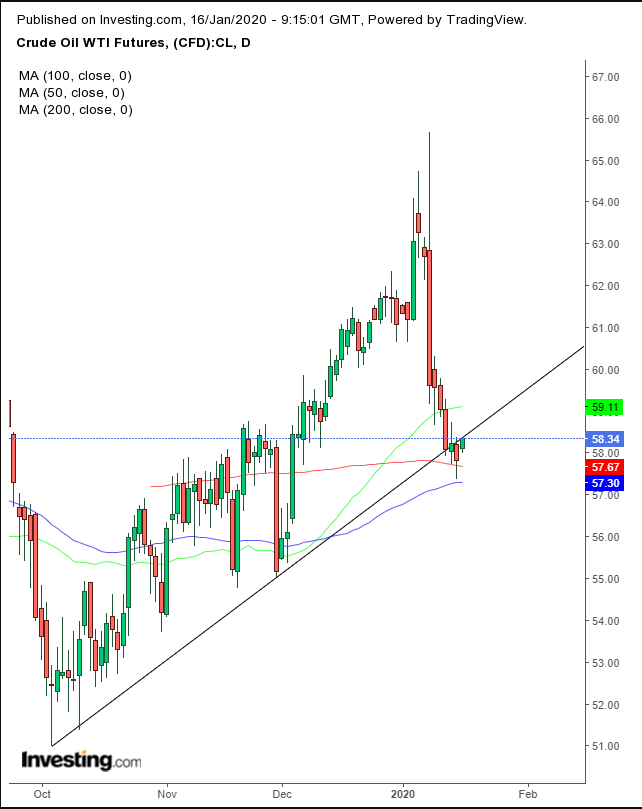
Oil rebounded but is still below its uptrend line since early October for the second day. This, after a Golden Cross in late December. For now, the price finds support above the 200 DMA.
Up Ahead
Market Moves
Stocks
- Futures on the S&P 500 Index increased 0.2% as of 8:07 a.m. London time.
- The Stoxx Europe 600 Index climbed 0.2%.
- The MSCI Asia Pacific Index advanced 0.2%.
Currencies
- The Dollar declined 0.1% to 97.15
- The euro was little changed at $1.1152.
- The British pound dipped 0.1% to $1.3031.
- The Japanese yen declined 0.1% to 109.96 per dollar.
Bonds
- The yield on 10-year Treasuries advanced less than one basis point to 1.79%.
- Germany’s 10-year yield decreased less than one basis point to -0.20%.
- Britain’s 10-year yield dipped less than one basis point to 0.65%.
