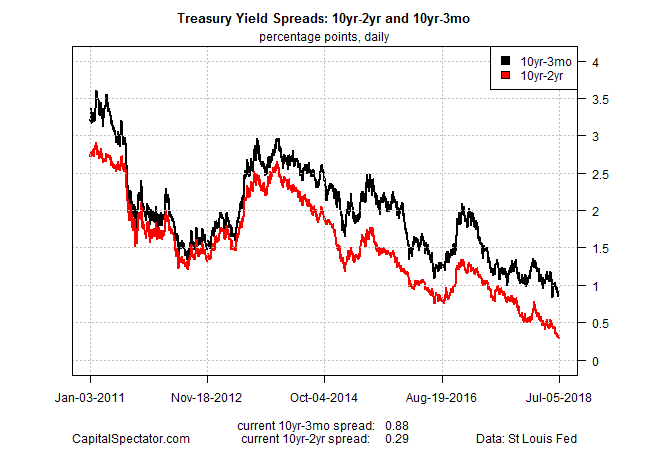
The yield spread for 10-year less 2-year Treasuries dipped to 29 basis points on Thursday (July 5), the lowest since August 2007. Will the Federal Reserve tempt economic fate with another rate hike that could push the 10-2-year spread into negative terrain, which would widely be interpreted as a warning that a new recession is near?
The subject was discussed at last month’s monetary policy meeting, according to yesterday’s release of FOMC minutes. Although a rise of short rates above long rates is considered as a sign that the risk is elevated for economic contraction, some Fed members downplayed the implied red flag via a flattening yield curve.
Participants pointed to a number of factors, other than the gradual rise of the federal funds rate, that could contribute to a reduction in the spread between long-term and short-term Treasury yields, including a reduction in investors’ estimates of the longer-run neutral real interest rate; lower longer-term inflation expectations; or a lower level of term premiums in recent years relative to historical experience reflecting, in part, central bank asset purchases. Some participants noted that such factors might temper the reliability of the slope of the yield curve as an indicator of future economic activity; however, several others expressed doubt about whether such factors were distorting the information content of the yield curve.
An alternative indicator of recession risk was discussed at the FOMC meeting, and one that some Fed members suggested could be more reliable than the 10-2-year spread: “the spread between the current level of the federal funds rate and the expected federal funds rate several quarters ahead derived from futures market prices. The staff noted that this measure may be less affected by many of the factors that have contributed to the flattening of the yield curve, such as depressed term premiums at longer horizons.”
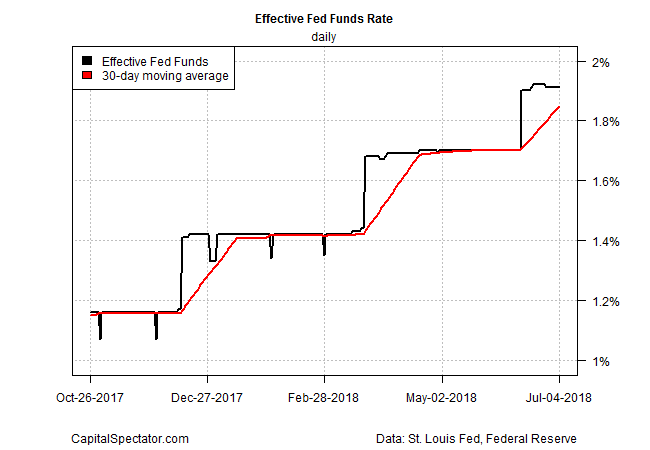
By that standard, the case for recession risk is somewhat weaker vs. the 10-2-year spread. For example, the current effective Fed funds rate (as of July 4) was 1.91% vs. an expected 2.25%-2.50% Fed funds rate for December 2018, based on the highest implied probability via futures prices, according to CME data published today. That translates to a positive rate-spread range of 34 to 59 basis points, or moderately above the current 29-basis-point difference for 10- and 2-year maturities.
The Fed’s alternative metric may hold sway for some central bankers, but there’s reason to be skeptical, according to Jim Vogel, a debt markets strategist at FTN Financial, via The New York Times. “The Fed is analyzing its own footprints,” he advises, which raises questions about the validity of the signal.
As for the 10-2-year spread, another rate hike may push the difference below zero for the first time in more than a decade. The next monetary policy announcement scheduled for August 1 is expected to leave rates unchanged but Fed funds futures are currently pricing in a roughly 78% probability that the Fed will lift its target rate to a range of 2.0%-2.25% on September 26 (up from the current 1.75%-2.0% range), based on the latest CME data. Assuming the 2-year yield moves up by a comparable amount suggests a 10-2-year spread at or near zero.

Whatever the implications of a narrowing rate spread, the Fed reasons that the economy remains strong and appears on track to accelerate, based on expectations for the second-quarter GDP report that’s due later this month. Indeed, the July 2 revision of the Atlanta Fed’s GDPNow estimate calls for a sharp upturn in Q2 growth to 4.1% from Q1’s modest 2.0% rise.
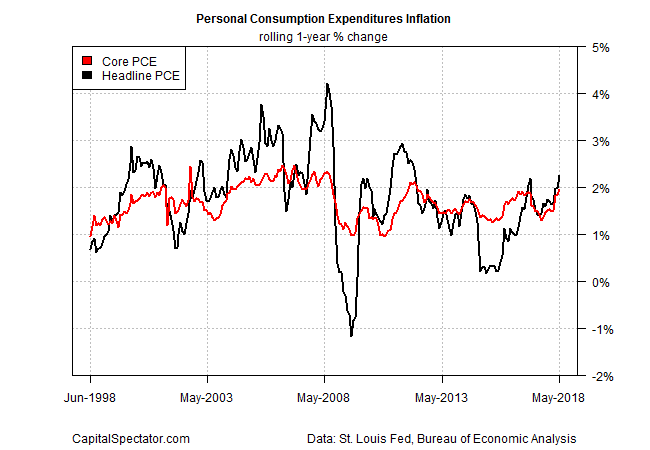
Another incentive for monetary tightening is the revival of inflation, albeit modestly so to date. The core rate of consumer prices, based on personal consumption expenditures (PCE), rose at a 2.0% annual rate in May. That’s the first time in six years that this inflation metric, which is closely monitored by the Fed, hit the central bank’s 2.0% target.

With inflation edging up and recent measures of the business cycle pointing to low recession risk (see last month’s economic profile for example), the Fed can still make a case for tighter policy. The rising trend for the effective Fed funds rate certainly suggests that policymakers are inclined to squeeze monetary conditions further in the months ahead.

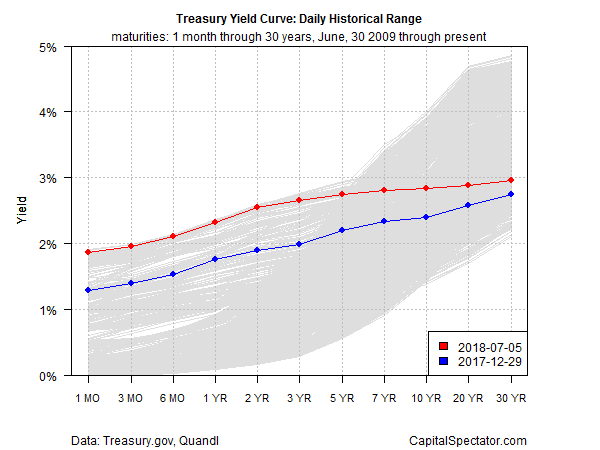
Nonetheless, it’s hard to ignore the fact that the Treasury yield curve is the flattest it’s been in years. Note, too, that this isn’t just about the 10-2-year spread. As the next chart below reminds, short rates in general are relatively high vs. history while long yields are comparatively low, as current yields show (red line).

The question is whether the Fed is sufficiently confident in its forecasting abilities to ignore the yield curve this time and push rates higher? That’s a reasonable assumption of what’s to come. Indeed, Jerome Powell, speaking at his first press conference as Fed chair in March, raised questions about the validity of the yield curve as an indicator of recession risk. The latest Fed minutes reveal that this skepticism has been embraced by at least some of the FOMC members.
But talk is cheap. All eyes will be on the Fed to see if it has the willpower to act and potentially engineer what will be widely viewed as a new recession signal.
The stakes are high, in part because the threat of a trade war is rising. New US tariffs on Chinese goods kicked in today and China retaliated. Although current estimates of trade-related blowback for the US economy are expected to be mild, the outlook could change, depending on how trade-policy decisions evolve in the weeks ahead.
“Clearly the first salvos have been exchanged and in that sense, the trade war has started,” says Louis Kuijs, chief Asia economist at Oxford Economics. “There is no obvious end to this.”
Meantime, the case for monitoring recession risk needs no explanation at this late date (the US expansion is currently the second-longest on record). The yield curve is still an obvious indicator to include on the short list, although routinely monitoring a broader set of numbers offers a higher level of confidence for analyzing the macro trend in real time (see a recent sample of The US Business Cycle Risk Report for details).
For now, recession risk is virtually nil, based on data published to date. But history tells us that macro risk can change quickly. The yield curve may or may not be an early warning for the next downturn. Fortunately, the rate spread isn’t the only game in town for developing solid intelligence on the state of US economic conditions.
