Monday's trading was characterized by the predominance of the side dynamics of quotations. Markets are waiting for a number of events that can significantly affect the situation. At the same time, a number of analyzed pairs recorded the emergence of a new series of technical signals indicating an increasing probability of a significant strengthening of the us currency in the coming trading sessions. In this regard, I urge everyone to strictly abide by the rules of competent money management.
Today is projected to be fairly quiet trade. An exception may be the publication, in the middle of the day, the data on the change in the UK. However, the impact of this information on the dynamics of the market will be local, since the players focus mainly on the summit of EU leaders opening tomorrow, at which another attempt will be made to reach a compromise on the Brexit issue.
It should be noted that in the charts attached to the review, the ranges between the support and resistance levels narrowed, reflecting the cautious position of the participants before the expected tumultuous events of the next days.
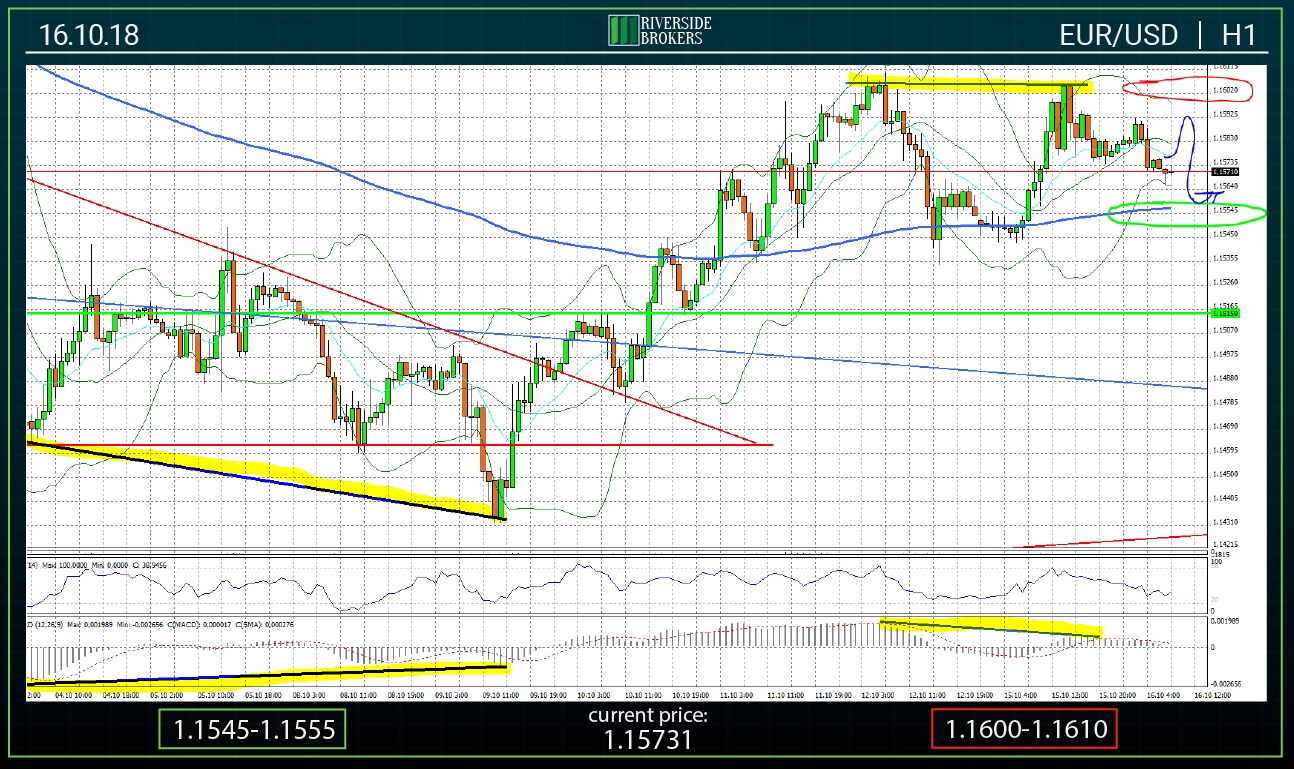
On Monday’s trading, the market players, amid the lack of important statistics and a half-empty news background, made an attempt to win back the losses of the last Friday in the EUR/USD pair and once again approach the resistance zone near the 1.1600 mark. However, this attack of buyers was repelled. Moreover, as a result of yesterday's quotes dynamics, a technical sell signal was formed. On the H1 time frame, there is a divergence between the local highs of prices observed in the first hours of trading on October 12 and yesterday, October 15, and the corresponding values of the MACD indicator, which indicates the probability of a new decline in the area of 200-periodic MA near the 1.1550 mark. When this scenario is implemented, a “double top” technical analysis figure will be formed on the pair: the top is around 1.1600, the neckline is the MA 1.1550 area above, the target of decline is below 1.1500, which means the return of quotes to the inside of the medium-term downward channel and further negative dynamics.
Monday's support and resistance zones did not change and they are located in areas 1.1545-1.1555 and 1.1600-1.1610, respectively.
GBP/USD
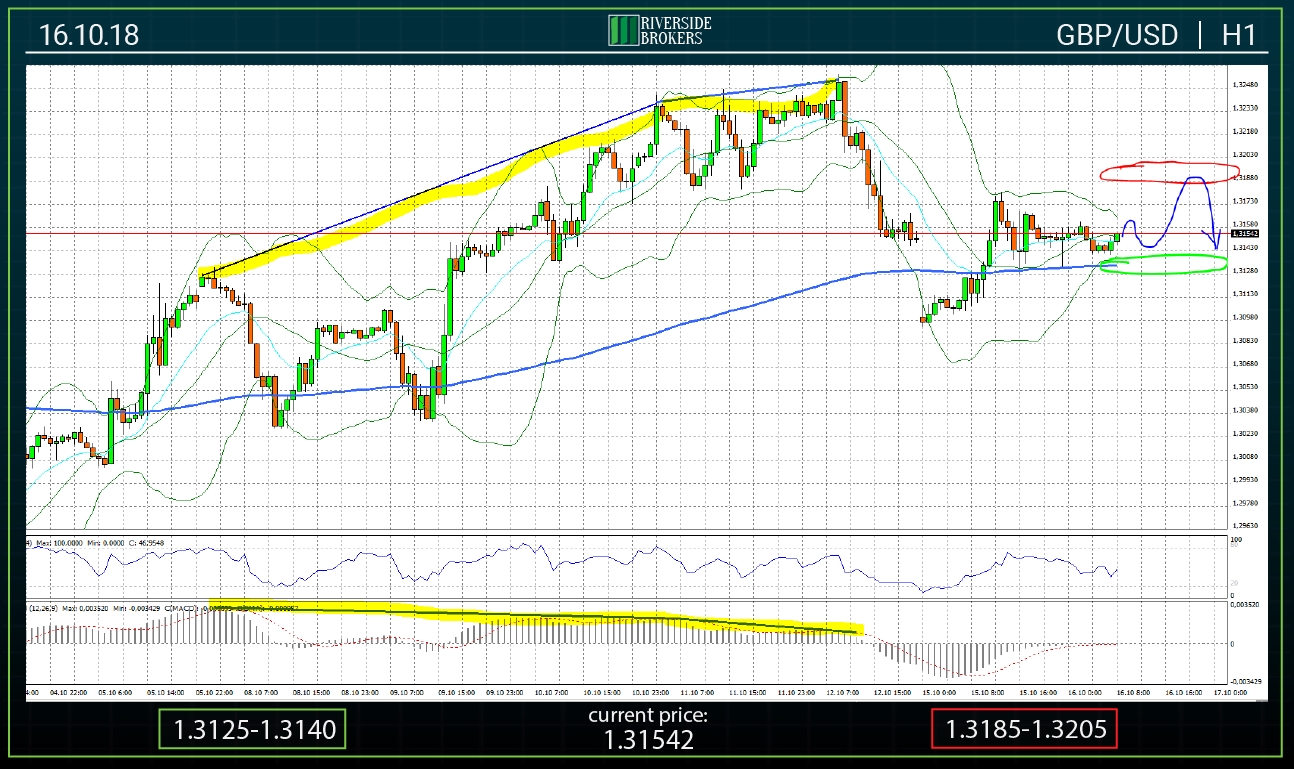
During Monday, the GBP/USD pair closed the price gap, which was formed as a result of the players' reaction to the message about a failed Sunday attempt to reach a compromise on Brexit. This fact indicates the prevalence of market sentiment on price increases. At the time of writing this overview was published the data on the UK labor market, which demonstrated assured positive dynamics of the average wage, which is a sign of accelerating inflation in the British economy and plays in favor of a faster coming for the period of normalization of the monetary policy of the Bank of England. After the release of data quotes pair rushed to the mark 1.3200. However, this movement is accompanied by a gradual formation of divergence between yesterday's highs, current prices and the corresponding MACD values. This circumstance allows us to suggest that the 1.3200 line today will not be overcome and prices will roll back down. Undoubtedly, the further dynamics of the quotes of the analyzed pair will strongly depend on the results of the EU-Summit that will open tomorrow. Today, fluctuations in the range of 1.3125-1.3200 are predicted.
The support zone today is in the area of 1.3125-1.3140 (green oval).
The resistance zone is in the range of 1.3185-1.3205 (red oval).
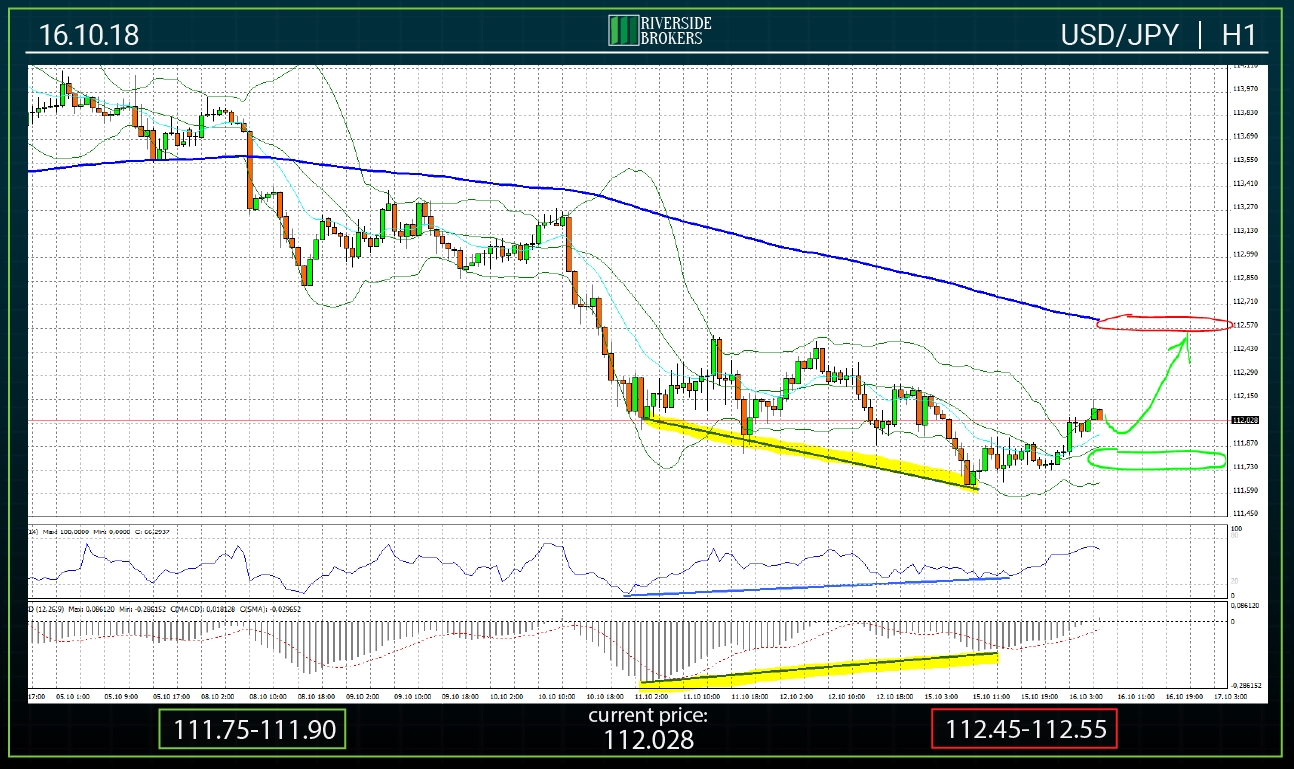
Following the results of yesterday's trading, from a technical point of view, a signal was formed indicating that the negative dynamics of the USD/JPY quotations ceased. On the H1 time frame, there is a convergence between the price lows and the corresponding MACD values. Based on this, it is predicted that quotations will return to the area of the 200-period MA, passing through the area 112.45-112.55.
The support zone is the range 111.75-111.90 (green oval).
The resistance zone is located in the area of 112.45-112.55 (red oval).
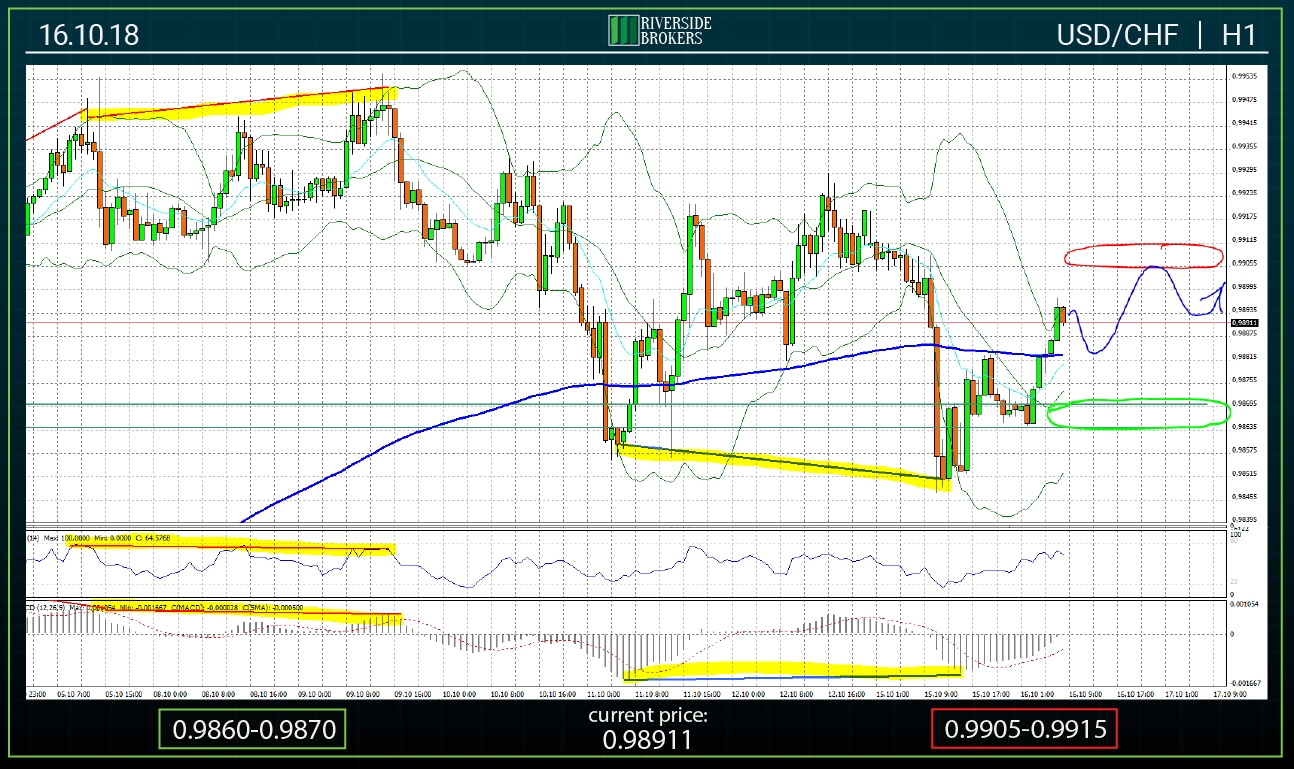
The technical picture of the USD/CHF pair is characterized by the formation of convergence between the local lows of quotations and the corresponding values of the MACD indicator. This fact indicates the probability of an increase in prices to the local resistance zone around 0.9900. It is predicted that today prices will fluctuate in the range of 0.9880-0.9910.
The support zone is in the area of 0.9860-0.9870 (green oval).
Resistance is in the range 0.9905-0.9915 (red oval).


