Get 40% Off
👀 👁 🧿 All eyes on Biogen, up +4,56% after posting earnings. Our AI picked it in March 2024.
Which stocks will surge next?
Unlock AI-picked Stocks

Oil’s Technical Resistance Stiffens Its Resolve

Published 11/10/2017, 05:35 AM
Updated 03/05/2019, 07:15 AM

Technical resistance and overbought short-term indicators are setting off more red lights on Brent and WTI charts as we head into the week’s end.

Oil traded with lots of noise overnight, but ended the session becalmed, with both contracts closing within 30 cents of their opening levels. This has been the picture since Tuesday in fact, with decent intraday volatility but with both Brent and WTI almost unchanged as we enter the last day of the week.

Of more concern is the technical picture for crude with WTI failing for the 4th day in a row below 58.00 and Brent unable to break its double daily top at 64.85. Brent, in fact, has tested and failed ahead of this level every day this week. Worryingly, both the Brent and WTI daily Relative Strength Index’s (RSI’s) remain at extremely overbought levels. When combined with the multiple day failures at resistance this week, the technical analysis picture is painting a very cautious picture for bullish oil positioning ahead of the weekend.

Brent crude is 20 cents higher from its New York close, at 64.20 in early European trading. Resistance is now clearly marked at the 64.80/65.00 area with a break implying further gains to 66.00. Support is at 63.10 and 62.50 with a failure there opening up a much deeper correction to 60.00.
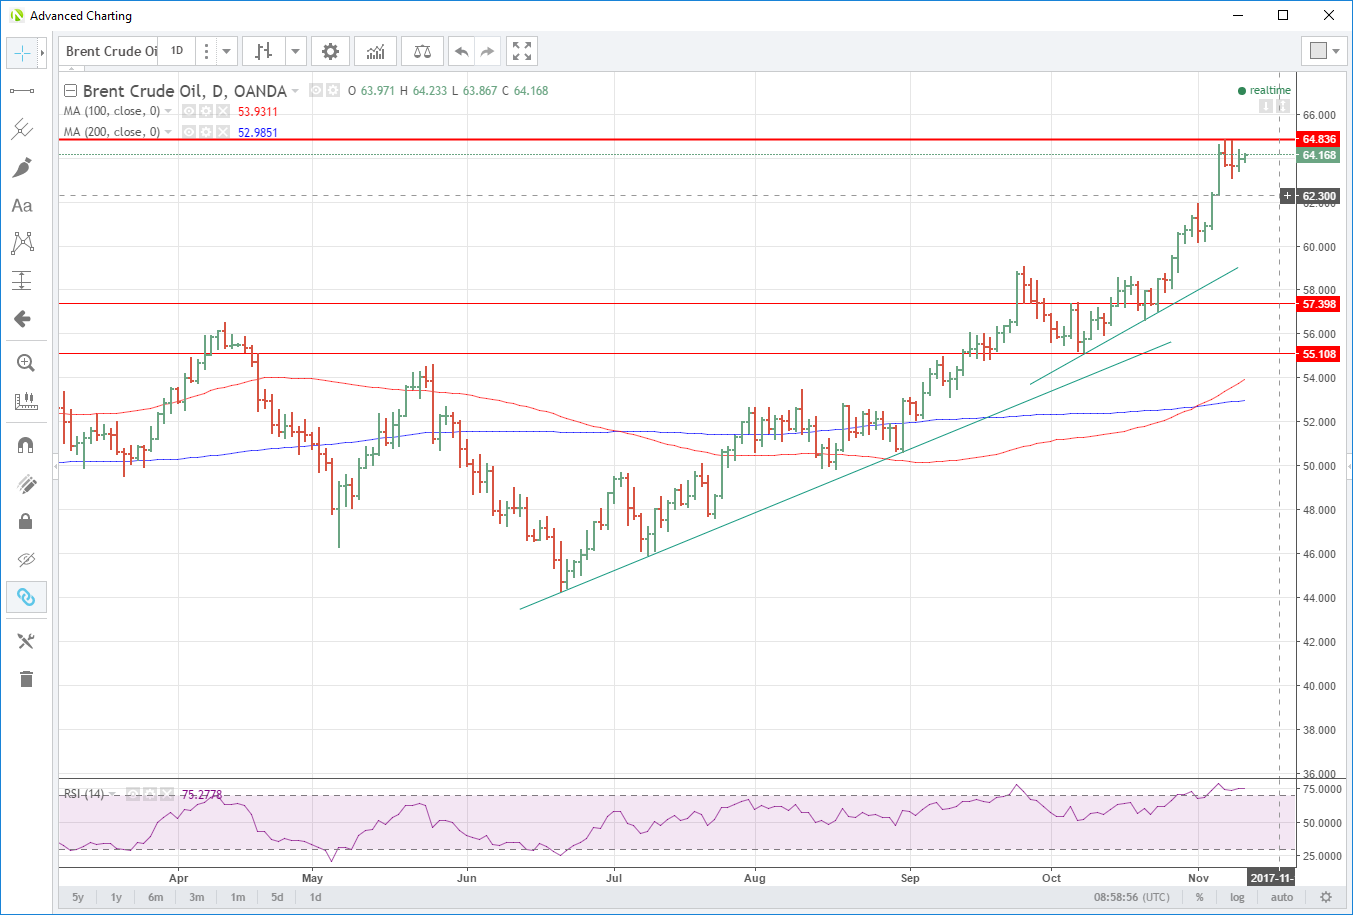
Brent Crude Daily Chart

WTI spot is unchanged at 56.95 and needs to capture the 57.80/58.00 region to inject new life into the bullish trend. A daily close above this level sets up a test of 60.00 and 61.00. Support is at 56.20 followed by 55.50 and then 53.70.
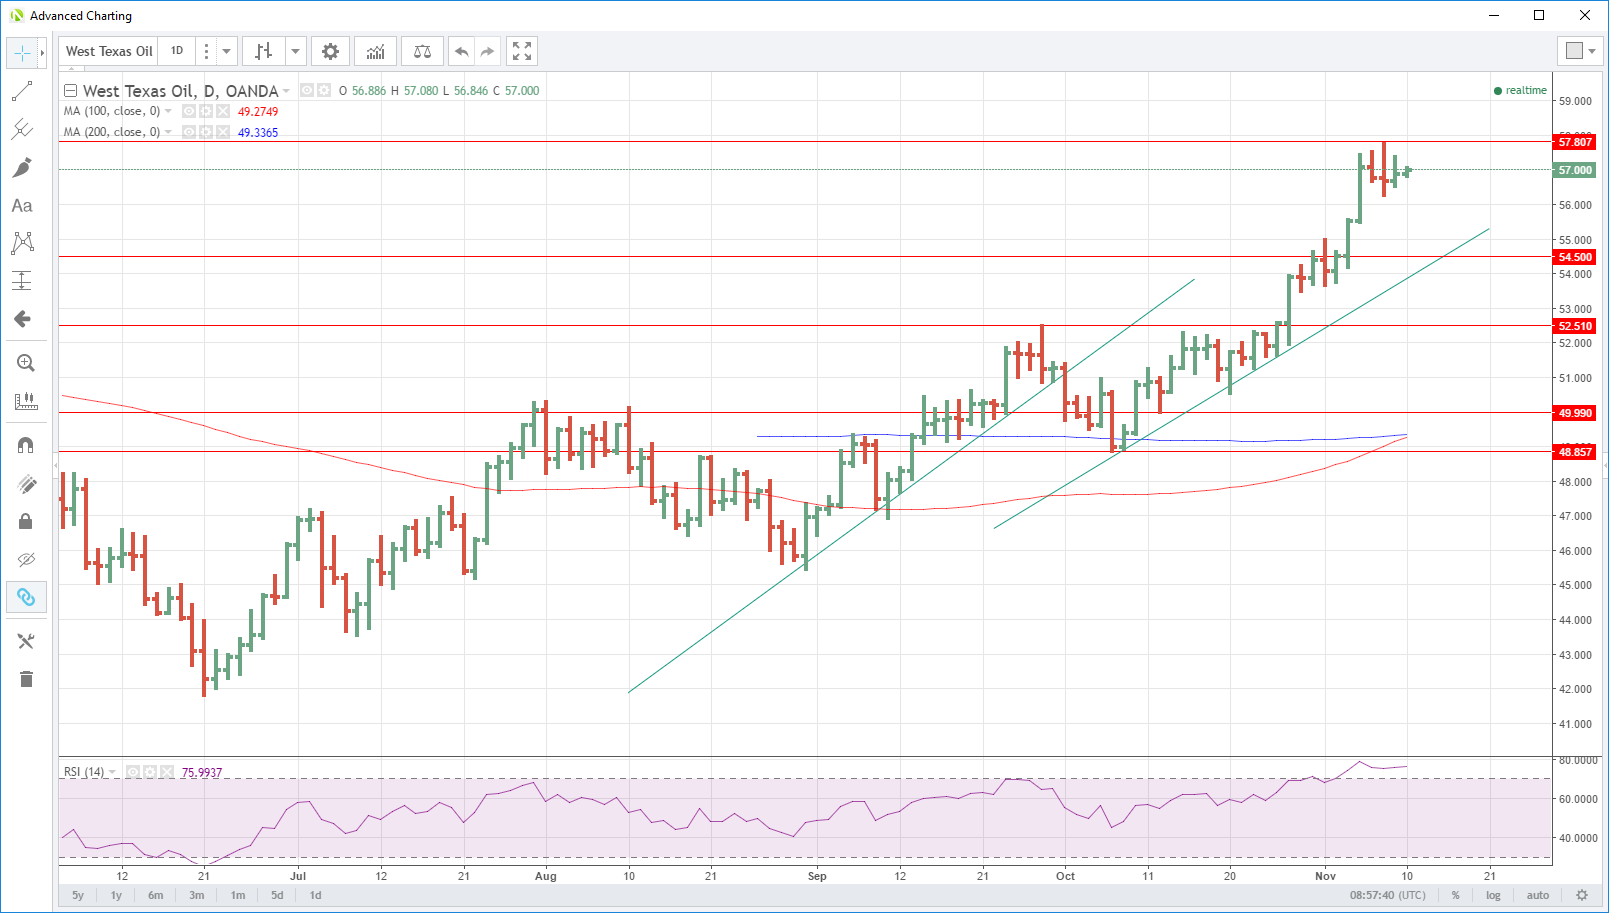
WTI Daily Chart

Original post

3rd party Ad. Not an offer or recommendation by Investing.com. See disclosure here or remove ads .

Latest comments

I’m not
Risk Disclosure: Trading in financial instruments and/or cryptocurrencies involves high risks including the risk of losing some, or all, of your investment amount, and may not be suitable for all investors. Prices of cryptocurrencies are extremely volatile and may be affected by external factors such as financial, regulatory or political events. Trading on margin increases the financial risks.
Before deciding to trade in financial instrument or cryptocurrencies you should be fully informed of the risks and costs associated with trading the financial markets, carefully consider your investment objectives, level of experience, and risk appetite, and seek professional advice where needed.
Fusion Media would like to remind you that the data contained in this website is not necessarily real-time nor accurate. The data and prices on the website are not necessarily provided by any market or exchange, but may be provided by market makers, and so prices may not be accurate and may differ from the actual price at any given market, meaning prices are indicative and not appropriate for trading purposes. Fusion Media and any provider of the data contained in this website will not accept liability for any loss or damage as a result of your trading, or your reliance on the information contained within this website.
It is prohibited to use, store, reproduce, display, modify, transmit or distribute the data contained in this website without the explicit prior written permission of Fusion Media and/or the data provider. All intellectual property rights are reserved by the providers and/or the exchange providing the data contained in this website.
Fusion Media may be compensated by the advertisers that appear on the website, based on your interaction with the advertisements or advertisers.
© 2007-2024 - Fusion Media Limited. All Rights Reserved.