Key Points:
- Momentum is slowing but may not be exhausted yet.
- The GDT Price Index could keep the bulls in play.
- Technical readings remain bullish, albeit to a lesser degree than last week.
The NZD/USD has been making remarkable progress over the past few weeks and the pair is now seeking fresh highs. Indeed, it looks as though the kiwi dollar is well on the way to reaching the 0.7374 mark – potentially inside of a week. As a result, it may be worth taking a closer look at what has been fuelling the pair recently and what could help to keep it bullish moving forward. Additionally, we might need to look at the technical bias and what this suggests is next on the cards.
The kiwi dollar continued to build on recent gains last week, reaching the 0.7329 handle by the close of trading on Friday. Much of this momentum stemmed from the technical bias which was quite bullish overall. However, the bulls were helped out by the broader swing against the USD resulting from the continued political turmoil in the US. Additionally, numerous NZ economic data releases came in better than anticipated. In particular, the ANZ Business Confidence and Building Consents Figures shot up to 24.8 and 7.0% respectively which saw sentiment remain with the pair throughout the week – even if the two releases were downed out on Thursday by the US GDP numbers.

As for the days ahead, it is yet another light week on the NZ news front but the GDT Price Index could prove to be particularly impactful this time around. This is largely due to the fact that its posting happens to fall on July 4th– a US public holiday – which means there is no American data to offset the dairy numbers. As a result, a solid uptick in the GDT figure could prove to be the spark needed to get the kiwi dollar to hit a high for the year at around 0.7374. As for the rest of the week, the US NFP data and the FOMC meeting minutes are likely to be the key risk events to watch for.
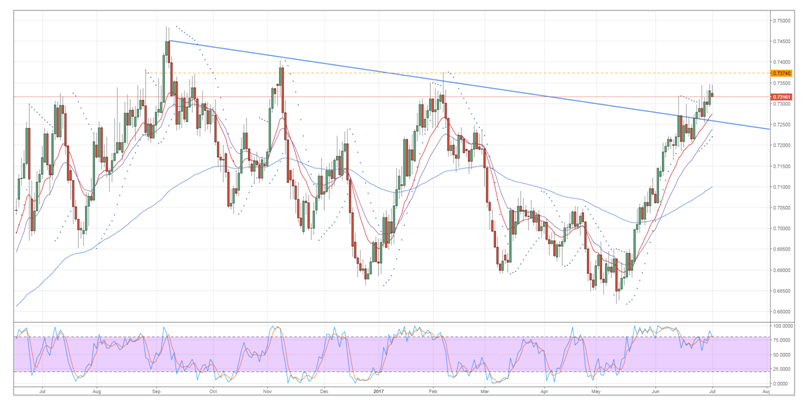
Moving on to the technical bias, the kiwi dollar remains rather bullish but becoming overbought will certainly see headwinds increasing moving ahead. Specifically, the bullish EMA and Parabolic SAR readings may no longer be enough to fuel the uptrend as both the RSI and stochastics have now moved into overbought territory. Additionally, the NZD may struggle to gain traction in the coming days as it is fast approaching fresh highs for 2017 which may be causing some of the bulls to spook.
Overall, expect further gains but resistance will be in place at the 0.7345, 0.7374, and 0.7454 levels. Conversely, support will be seen at the 0.7298, 0.7243, and 0.7194 levels.
