I have quite a few clients in their eighties and a number in their late eighties. That is not particularly surprising when your client base is chock-full of retirees and near retirees.
What did surprise me a bit is a call from an 87-year old client yesterday afternoon. She called to inquire why her friends are making more money in the stock market than she has been making recently.
“Are most of your friends in their 40s or 50s?” I asked.
“No, they’re my age,” she said.
“Well, then. The advisers for your friends could be in a heap of trouble someday.”
“What do you mean?”
“I mean that we have 50% of your account in stock assets and your account is growing in value at approximately half the pace of the U.S. stock market. And while there are no flawless rules for an 87-year old’s stock allocation, most advisers might peg it closer to 33%. So in order for your friends to be making more than you in stocks, their advisers would likely be risking 60%-70% in stocks, instead of the prescribed 30%-40%. And that amount of risk taking would be seriously frowned upon by the CFP Board as well as the Securities and Exchange Commission.”
“Oh,” she said. “So then I also have too much in stocks, right?”
“If I were holding-n-hoping with your 50% stock allocation indefinitely, then yes,” I said. “However, we rebalance accounts when certain conditions are met. When the monthly market price breaks below its long-term trendline, we will reduce your stock allocation to 25%. That is how we protected you in the 2008 financial crisis.”
“I know, I know! I tell my friends all of the time how little I lost in 2008!” she said enthusiastically.
Shortly after we ended our telephone conversation, I flashed back in time to the late 1990s tech boom. Was this interaction emblematic of the greed near the peak of the 2000 bubble?
Anecdotally speaking, the 2000 bubble fostered a greater amount of ‘get-rich-quick’ scheming. What’s more, equity fascination had largely been a baby boomer demographic thing — people in their peak earning years had come to believe stock assets could not fall in value. Meanwhile, retirees in the late 1990s could earn extremely respectable returns by diversifying with risk-free Treasuries and investment grade bonds.
The difference today? Millennials, GenXers, Baby Boomers – investors in their 20s, 40s, 60s and 80s – are ubiquitous in their fear of missing out on the ultimate stock party. Even 87-year old widows.
Making matters worse, central bank rate manipulation has made it difficult to earn a reasonable return by diversifying with higher quality fixed income assets. Since the Federal Reserve began manipulating borrowing costs lower in the mid-80s, each subsequent recession has required interest rates to be much lower for much longer than the previous contraction.
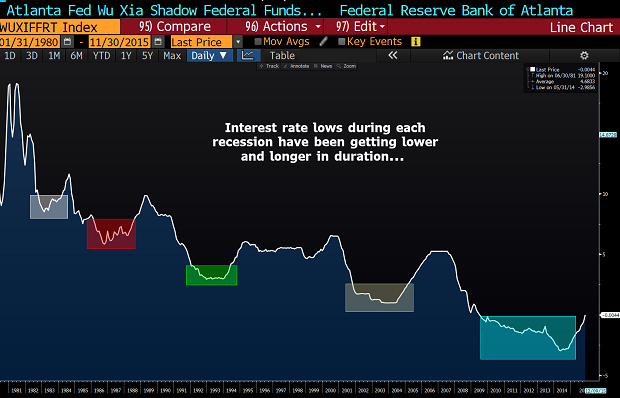
With investment grade interest yielding so little, it has become stocks or bust for many folks who do not have the luxury of time. Yet a ‘bust’ is what a large percentage of older people are not prepared for.
Here in January of 2018, stocks have not pulled back 2% for five-plus months; they have not corrected a mere 3% in 15 months or 5% in 19 months. It appears as though the fear of missing out on the uptrend has become so pronounced that buyers no longer wait for the most modest of pullbacks to acquire shares lower.
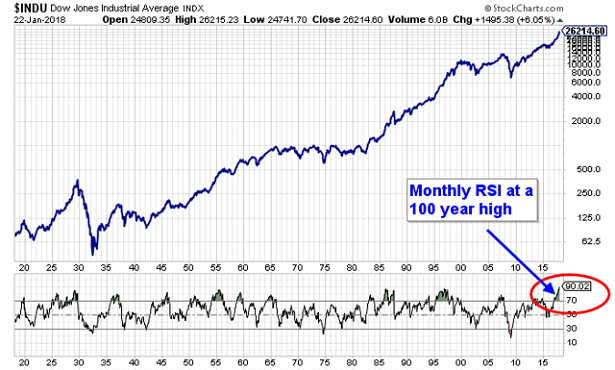
Consider the relative strength index (RSI) for the Dow Jones Industrials. Matthew Yates, a Seeking Alpha contributor, demonstrated that the monthly RSI is higher than it has ever been in the past 100 years. The elusive monthly RSI reading of 90 did not even occur during the irrational exuberance leading into 1929. Yet peaks for monthly RSI values are associated with increased risks of near-term price reversals.
Another technical indicator, Average Directional Movement (ADX) captures the strength or weakness of a trend. Most analysts follow the heuristic that ADX readings (14-period) over 30 confirm strong uptrends. And that’s a good thing. After all, the “trend is your friend.”
However, an uptrend can jump the proverbial shark. For instance, extreme ADX readings of 56 preceded the stock market crash of 1987 as well as the financial collapse of 2008. Historic extremes in terms of trend strength, then, often precede disaster.
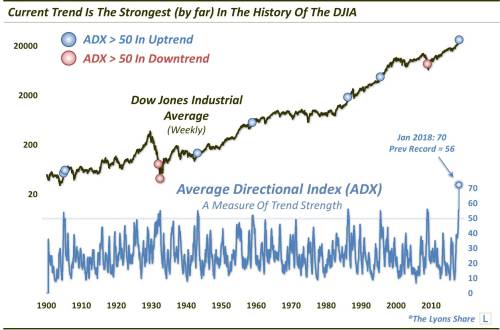
Dana Lyons of The Lyons Share points out that the current ADX reading of 70 has rocked the record books. The current uptrend’s strength is, for better or worse, incomparable.
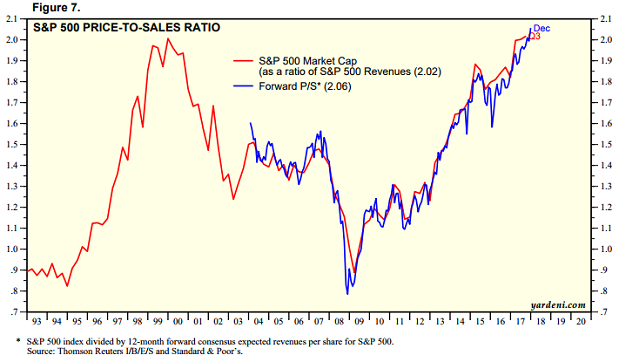
Keep in mind, however, when one couples severely overbought levels (e.g., RSI, ADX, etc.) with the knowledge that stock market overvaluation is also pushing on a string, stock price reversion may not be far behind. If nothing else, a sharp spike in volatility might be preordained.
As if overbought, overvalued conditions were not enough to ponder, the Rydex Bull-Bear asset ratio has eclipsed even the most bullish extremes. Bullish assets currently outstrip bearish assets by a factor of 20. Imperfect sentiment indicator notwithstanding, the discovery is downright mind-boggling.
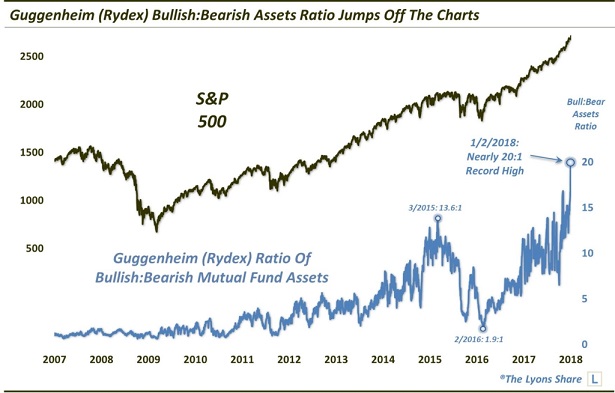
Not to fret, though. The melt-up in stocks implies that there is nothing to fear but fear of missing out (FOMO) itself.
Disclosure Statement: ETF Expert is a web log (“blog”) that makes the world of ETFs easier to understand. Gary Gordon, MS, CFP is the president of Pacific Park Financial, Inc., a Registered Investment Adviser with the SEC. Gary Gordon, Pacific Park Financial, Inc., and/or its clients may hold positions in the ETFs, mutual funds, and/or any investment asset mentioned above. The commentary does not constitute individualized investment advice. The opinions offered herein are not personalized recommendations to buy, sell or hold securities. At times, issuers of exchange-traded products compensate Pacific Park Financial, Inc. or its subsidiaries for advertising at the ETF Expert website. ETF Expert content is created independently of any advertising relationship.
