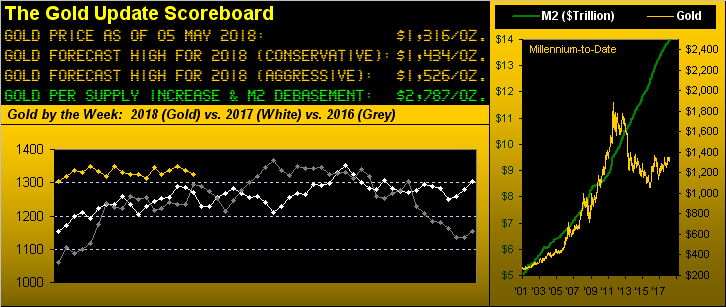
Rhetorical questions, by rationale, are rooted in truth. We all know some of the classics: "Does a bear relieve itself in the woods?" "Do politicians do different from that which they promise?" "Is the stock market going to crash?" "Are the Cleveland Browns a bad football team?" And as we herein queried a week ago, will it be "Another May of Dismay for Gold?" Why even ask, eh?
This past Tuesday with May Day barely underway, (the Euro-bourses shut in honour of property destruction), Gold wasted no time ringing in its month of dismay by promptly making a new low for the year, trading down to 1302.3 at precisely 07:53 Pacific Time. And to quite literally put a big red cherry on top of it, Gold's weekly parabolic trend flipped to Short, price then settling the week yesterday (Friday) at 1316. No surprise:
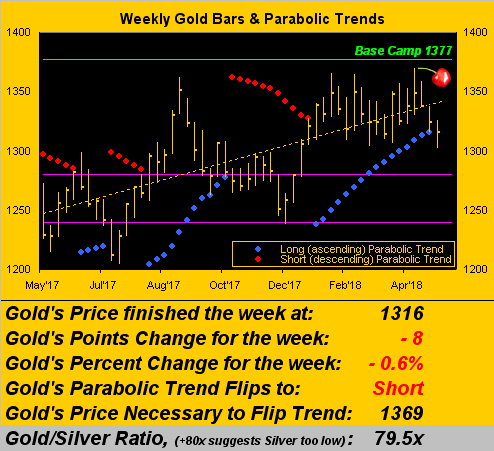
Aiding (indeed abetting) Gold's demise were those dirty Dollar traders, who in just the past three weeks have pushed their Index from 88.945 to now sit at 92.425, the biggest like-period upswing since year-end post-election posturing back in December 2016. And whilst never abetting (albeit not helping) was the report from our friends over at the World Gold Council of the global demand for Gold bars and exchange-traded funds backed by such as falling to a 10-year low, and thus directionally did Gold go.
"So how far down from here, mmb?"
Squire doesn't mince his words, does he? Thus with a Market Rhythms analysis, we've just come up from the air-conditioned computer room wherein we ran Gold's weekly parabolic punch cards through the IBM (NYSE:IBM) 360 and here's what it found:
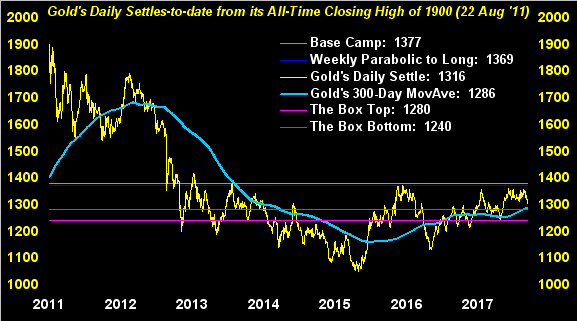
For the past two years covering 10 weekly parabolic flips, (i.e. five to Long and five to Short), price's average maximum follow-though was 52 points and the median maximum was 44 points. Technically for this new flip to Short, we'll measure such distance from the opening price of this ensuing week. But using the present 1316 level as a surrogate, less 52 points = 1264, (or less 44 points = 1272). That said, we know -- for what has now been years -- Gold nauseatingly finds endless price consternation 'round Neverland, (aka "The Whiny 1290s"), and failing that, The Box (1280-1260). Shorting Gold is a bad idea, we oft say, but as 'tis the month of May, prudent cash management is the right play.
Coming as well into play by the look of Gold's current downtrend on the daily chart appears a test of the 300-day moving average -- the bright blue line we see here -- presently at 1286, which vis-à-vis Neverland and The Box lies betwixt:
Betwixt higher and lower as well is the Economic Barometer, the past week's incoming metrics quite mixed. According to the Department of Labor Statistics, April jobs growth increased; according to Automatic Data Processing, it decreased. The rate of Unemployment declined, but growth in Hourly Earnings slowed. The pace of Personal Spending in March increased; the pace of Personal Income decreased. Q1 Productivity increased; but so did Q1 Unit Labor Costs. March Factory Orders rose, but Construction Spending fell. The trade deficit was reduced in March and the Chicago Purchasing Managers' Index increased in April; yet March's Pending Home Sales significantly slowed, along with slippage in both the Institute for Supply Management's April Manufacturing and Services Indices as well as in Vehicle Sales. Too much information? That's the beauty of the single blue Baro line:
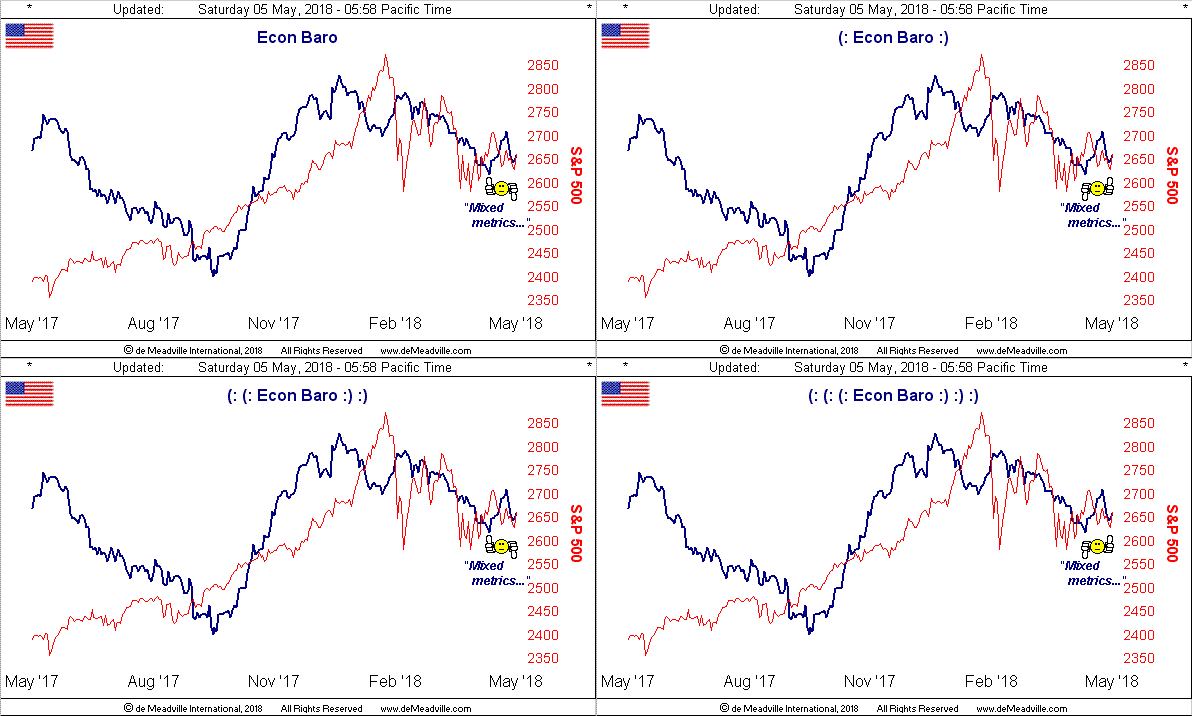
And amidst it all, the Personal Consumption Expenditures Price Index is closing in on the Federal Open Market Committee's preferred year-over-year target of 2%. They've got their full employment; they've got their preferential inflation; they've got the word "Go!" to further withdraw dough. Fortunately, we're told that Q1 Earnings Season is "Great!" despite the price/earnings ratio of the S&P 500 having not fallen: Bob Shiller's CAPE measure is 31.7x; our "live" measure is 55.3x (and the unweighted median is 38.4x). As for the Index itself portrayed by the red line in the above chart, its state remains one of chaotic confusion -- which we all know leads to you-know-what: as appeared amongst the Dow Jones wires this past week: "The new stock-market fear: Signs that a period of harmonious global growth is crumbling."
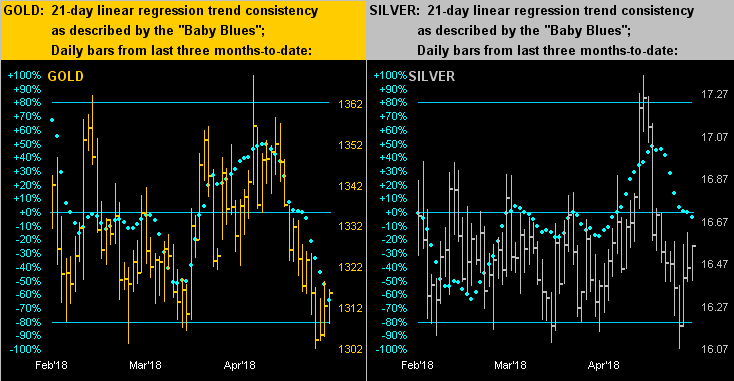
And when all around goes crumblin' one expects the precious metals to be a-bubblin'. So even starting May in affright, they spent the balance of the week attempting to put it right. But the descending blue dots of regression trend consistency that we next see across the daily bars for Gold on the left and Silver on the right are proven technical negatives and they've further room to fall -- certainly so for the latter, albeit Sister Silver "loves" being at home in the 16s:
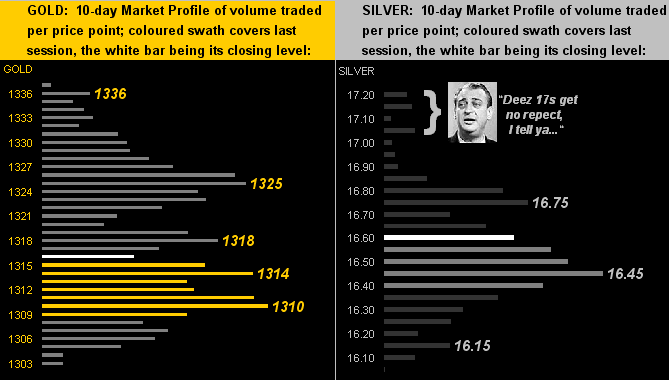
Nearer-term per their respective 10-day Market Profiles, both Gold (left) and Silver (right) have bounded off their bottoms, the support and resistance trading apices as denoted:
In sum, of this year's 251 total trading days, 166 (66%) await in the balance. And thus far in 2018, Gold has (barely) survived dipping into the 1200s. But shall they trade? "Yes", (barring some fundamental saving grace immediately swooping in to save the day); indeed we expect to see the 1200s as this new parabolic Short trend runs its course. Yet shall Gold then reverse up to finally reach Base Camp 1377 this year? "Yes!", (barring bits**t -- which Nouriel "Dr. Doom" Roubini this past Wednesday declared as bulls**t at the Milken Institute Global Conference in New York -- gaining global acceptance as the world's currency). And in turn, upon Gold reaching all those lovely "buy stops" up there at 1377, do we still anticipate seeing 1434 as this year's (conservative) high trade for Gold? "Absolutely!"
Meanwhile as duty calls, 'tis back to the computer room...