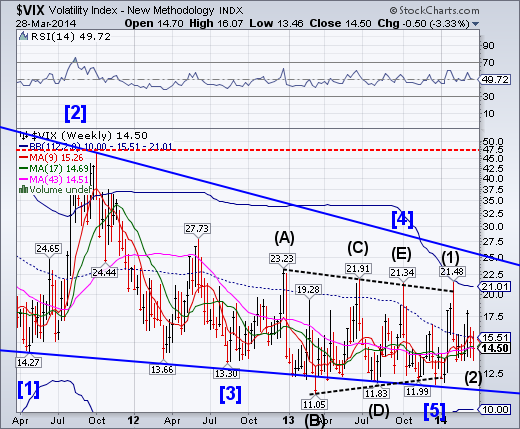
The Volatility S&P 500 made a new Master Cycle low on Wednesday, but still managed to close at weekly Long-term support at 14.50. This is the prelude to a probable run to the top of the chart that may occur over the next several weeks. Despite the constant late-day VIX selling for the past month, it has managed to maintain a higher base since the beginning of the year.
SPX eased down to the Wedge trendline.
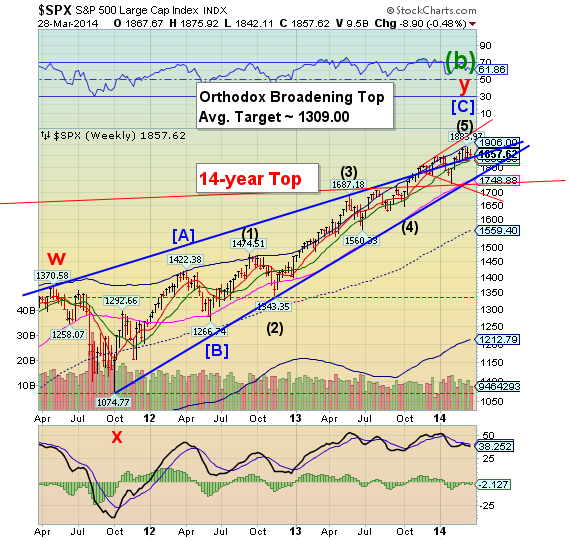
The S&P 500 has been stair-stepping down to close within 10 points of its year-end value at 1848.36. It is barely hanging on to a gain for the first quarter, while the Dow is down 265 points from its year-end. There is a good probability that SPX may finally come off the ledge that is the upper trendline of the Bearish Wedge. In the process it may also break two important Cyclical supports at 1840.00 and 1829.00.
Bloomberg: U.S. stocks climbed after a two-day slide, as consumer shares rebounded amid data showing household purchases rose the most in three months. Biotechnology shares extended losses, weighing on the Nasdaq Composite Index.
The Standard & Poor’s 500 Index added 0.5 percent to 1,857.62 at 4 p.m. in New York, trimming its loss for the week to 0.5 percent. The Dow Jones Industrial Average rose 58.83 points, or 0.4 percent, to 16,323.06 today. The Nasdaq Composite increased 0.1 percent to 4,155.759, completing the week with a 2.8 percent drop.
NDX declines to its Ending Diagonal trendline.
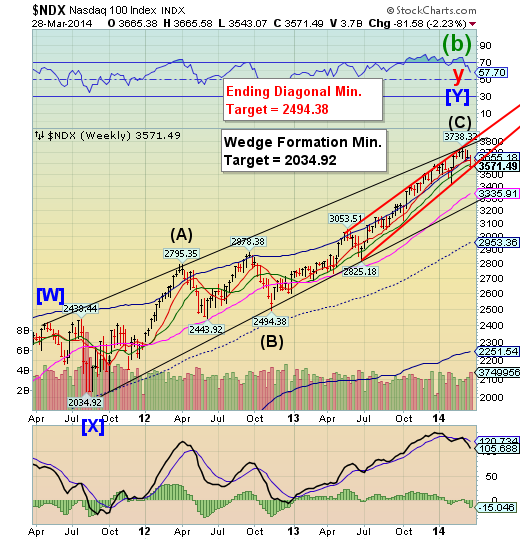
NDX declined beneath three major weekly supports and closed at its Ending Diagonal trendline. It is already at a loss for the first quarter and a further decline may put last year’s entire gain of 35.9% in jeopardy. The Cycle Top is no longer support, so there is a good probability of a fast decline once the trendline is broken. This support must be broken to begin the change in trend.
ZeroHedge: Yesterday's late bounce and this morning's opening follow-through were heralded by many talking-heads this morning as the end of the sell-off and a great buying opportunity. Well, on the bright side, those stocks are now at least 3% cheaper having plunged from the opening highs - even as the broader indices hold in. The Momos, also considered to have seen the worst, are re-collapsing...
The Nasdaq 100 andRussel 2000 are now red YTD once again
The Euro consolidates lower.
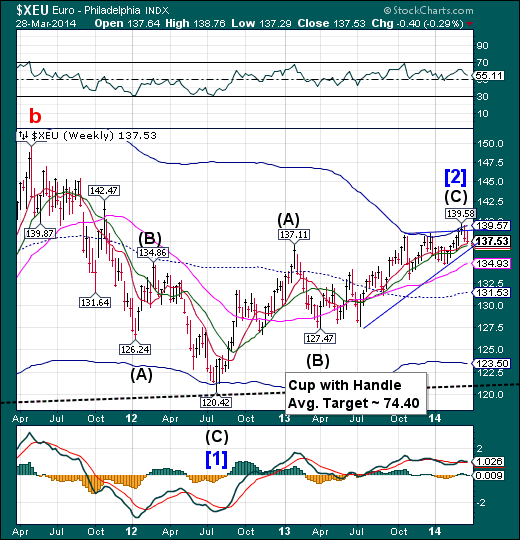
The Euro attempted to rally above its Ending Diagonal but failed, ending with a small loss. It still must decline beneath its Cyclical supports to gain downside momentum. The lower trendline of the Ending Diagonal is important, since a decline beneath it may imply a further decline to the July low.
CNBC: The euro fell to three-week low against the dollar on Friday, with investors wary given strong rhetoric from European Central Bank officials about its recent strength and awaiting German inflation data that could undermine it further.
Slightly soft Spanish inflation numbers led to a drop in the euro in early trade in London, with more sellers likely to line up if German inflation data, due at 1300 GMT, highlights subdued price pressures in Europe's largest economy, traders said.
EuroStoxx resolves inside candle to the upside.
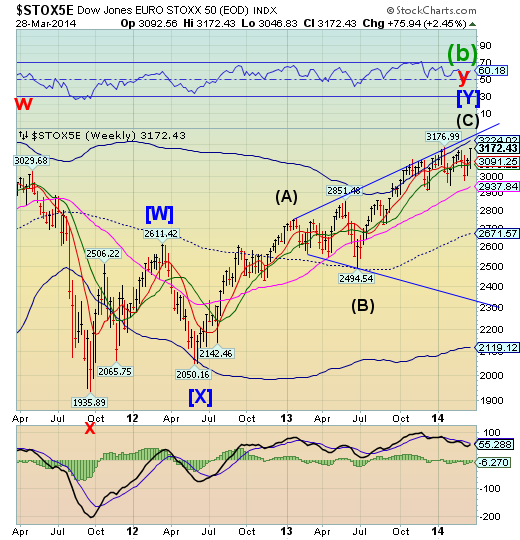
The EuroStoxx 50 index had an upside breakout this week, after a week of indecision. This breakout appears to be an extension and may challenge its ultimate resistance at the weekly Cycle Top at 3224.02.
Reuters: European stocks rallied on Friday, with Milan's benchmark index hitting a near three-year high, lifted by mounting expectations that the European Central Bank may ease policy next week to support the region's fragile economic recovery.
Speculation that China could step in to stimulate its economy also helped lift sentiment, boosting shares of metal and mining stocks, with Anglo American up 1.5 percent and Glencore Xstrata up 2 percent.
The FTSEurofirst 300 index of top European shares ended 0.8 percent higher, at 1,332.29 points, while Milan's FTSE MIB index surged 1.5 percent, hitting a level not seen since May 2011.
The Yen loses Short-term support, stops at Intermediate-term support.
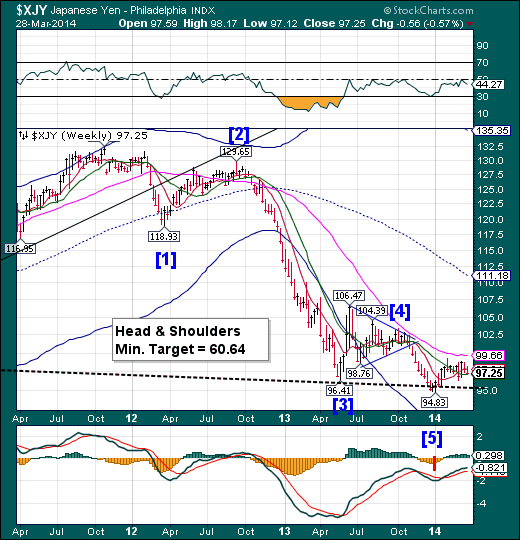
The Yen declined beneath its short-term support at 97.81, but found Intermediate-term support at 97.09. There is an opportunity for the Yen to rally, should this support hold. The dollar/yen carry trade is dependent upon a declining Yen. Despite a strong USD/JPY ramp on Friday morning, there was no follow-through, raising questions of sustainability.
Bloomberg: Japan’s encouragement of yen depreciation to boost the economy threatens to backfire by making the country dependent on foreign investors for funding.
That’s the very same economic weakness that prompted Morgan Stanley to describe emerging-market currencies from South Africa’s rand to Turkey’s lira last year as the “fragile five.” While the yen is still regarded by investors as a safer bet than any of those developing currencies, the prospect of 33 years of current-account surpluses coming to an end may dent its appeal as a haven, according to Brown Brothers Harriman & Co.
The Nikkei is testing Short-term resistance.
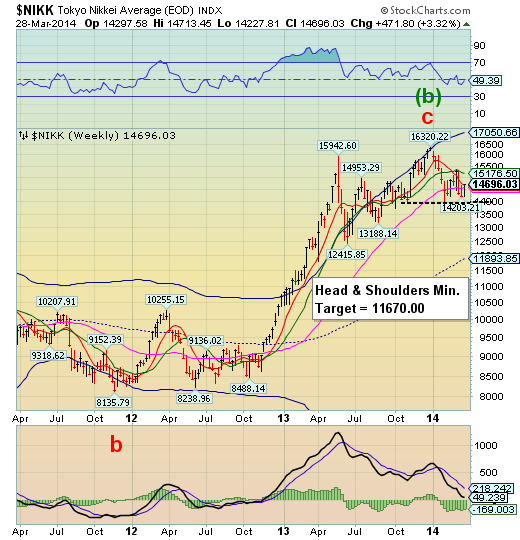
The Nikkei rallied away from its Head & Shoulders formation, but stalled at weekly Short-term resistance. Should it resume its decline beneath the neckline, the Nikkei may drop below its weekly mid-Cycle support at 11893.85. The Cycles Model projects a decline into early April.
Bloomberg: Japan’s Topix index rose for a fifth day, capping its biggest weekly advance in four months, as consumer lenders and airlines led gains.
Consumer-finance and leasing company Orix Corp. added 4.3 percent. Japan Airlines Co. climbed a second day for the biggest advance among air-transport shares. A TOPIX gauge tracking brokerages rose 2.4 percent after dropping the most among the broader measure’s 33 industry groups yesterday. Yahoo Japan Corp. plunged 6.4 percent after agreeing to buy parent SoftBank Corp.’s broadband-service provider eAccess Ltd. for 324 billion yen ($3.2 billion). SoftBank slid 1.5 percent.
The Topix increased 0.8 percent to 1,186.52 at the close in Tokyo, after falling as much as 0.7 percent. The gauge’s five-day winning streak is the longest since October. The measure capped a 3.5 percent gain this week, its biggest such gain since the period ended Nov. 15. The Nikkei 225 Stock Average rose 0.5 percent today to 14,696.03.
U.S. Dollar challenges the Triangle trendline.
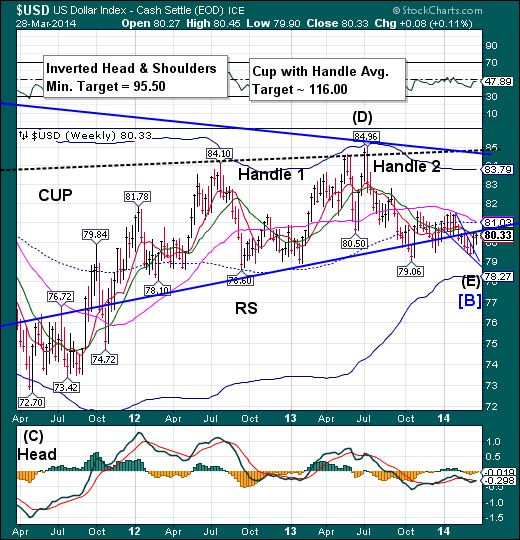
The Dollar eked out a small gain as it challenged the lower trendline of its massive Triangle formation. While breaking above the trendline the dollar may also emerge above Intermediate-term resistance at 80.4. What appears to be a temporary reversal may become a real problem for the Dollar bears.
Investing.com: Solid personal spending data in the U.S. sent the dollar firming against most major currencies on Friday, though profit taking cooled the greenback's gains. In U.S. trading on Friday, EUR/USD was up 0.07% at 1.3751.
The Commerce Department reported earlier Friday that U.S. personal spending rose 0.3% in February, in line with expectations, Personal spending in January was revised down to a 0.2% gain from a previously estimated 0.4% increase.
A separate report showed that the core U.S. personal consumption expenditures price index remained unchanged at 0.1% last month, in line with expectations.
Elsewhere the revised Thomson Reuters/University of Michigan consumer sentiment index ticked up to 80.0 in March from 79.9 the previous month. Analysts had expected the index to rise to 80.5 this month.
Treasuries have a week of indecision.
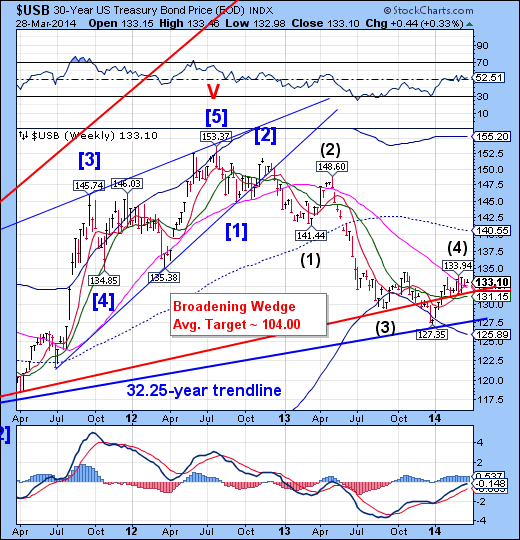
Treasuries made a small gain above Long-term support at 132.32. The Cycle high made on March 3 remains intact. Should the March 3 high remain, we may see a surprise collapse in bonds over the next two weeks.
ZeroHedge: The short-end of the Treasury curve continues to reprice higher in yield (3Y +2bps) as the term structure bear-flattens with 30Y yields rallying further after the aggressive 7Y auction. 30Y yields just broke below 3.5% (-4.5bps) - the lowest level intraday since early July 2013. 2s10s are now at 2.21% - near 10-month lows - and 5s30s has plunged to 1.80% - its flattest since September 2009.
Gold extends its decline.
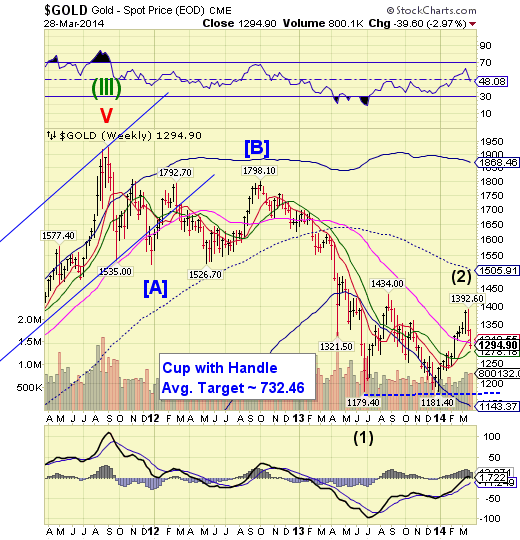
Gold extended its decline to challenge weekly Intermediate-term support at 1278.18. A further breakdown may challenge the Lip of a Cup with Handle formation in the next week or so. The potential consequences appear to be severe.
Forbes: Gold prices are $100 off their price peak from two weeks ago, and gold-market analysts said they’re going to watch technical charts to see how the yellow metal behaves next week and whether or not the slip in prices spurs physical demand.
June gold futures fell Friday, settling at $1,293.80 an ounce on the Comex division of the New York Mercantile Exchange, down 3.2% on the week. May silver rose Friday, settling at $19.790 an ounce, down 2.6% on the week.
Crude extends its rally.
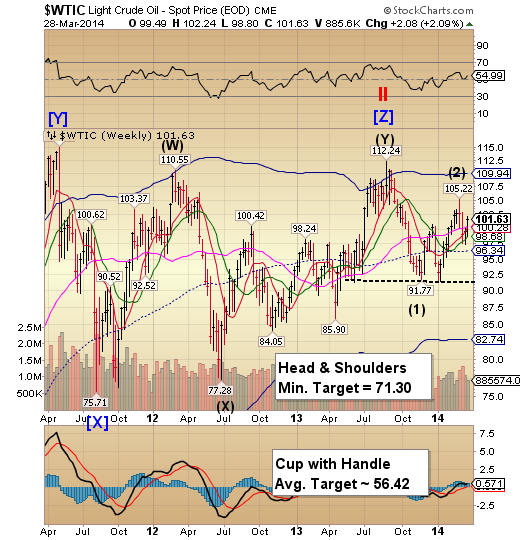
Crude broke above Long-term resistance at 100.28 to complete a 65.7% retracement of its initial decline from its March 3 high. This action may be setting up crude for a hard reversal next week. A subsequent decline may lead to the Head & Shoulders formation at the base of this rally, which may be overshadowed by the Cup with Handle formation with an even deeper target.
Reuters: Brent crude oil rose for a fourth straight session on Friday, notching its first weekly gain since February, on promising U.S. economic data and concern that possible Western sanctions on Russia's energy sector could disrupt global supplies.
The United States and NATO have voiced alarm over what they say are thousands of Russian troops massed near its western border with Ukraine. Russian President Vladimir Putin has reserved the right to send troops into Ukraine, home to a large population of Russian-speakers in the east. U.S. crude oil rose for its third session on data showing consumer spending increased in February, lifted by an increase in services consumption, news that also buoyed the U.S. equities markets for most of the session. However, a dip in consumer sentiment this month offered confirmation that economic growth slowed in the first quarter.
China stocks fail at Intermediate-term resistance.
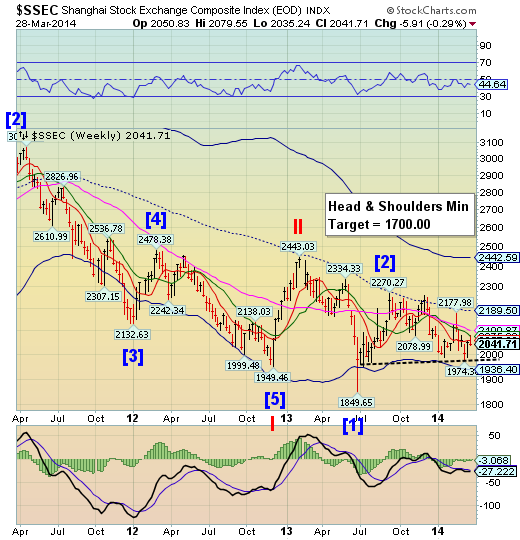
The Shanghai Index challenge both Short-term resistance at 2057.22 and Intermediate-term resistance at 2075.88 before dropping beneath both this week. The brief bounce called for by the Cycles Model is now complete. It may now resume the decline beneath the neckline. The ensuing decline may be swift and deep. There is no support beneath its Cycle Bottom at 1936.40.
ZeroHedge: Over the past month, we have explained in detail not only how the Chinese credit collapse and massive carry unwind will look like in theory, but shown various instances how, in practice, the world's greatest debt bubble is starting to burst, resulting not only in the first ever corporate default, but also in the bursting of the associated biggest ever housing bubble. One thing we have not commented on was how actual trade pathways - far more critical to offshore counterparts than merely credit tremors within the mainland - would be impacted once the nascent liquidity crisis spread.
Today, we find the answer courtesy of the WSJ which reports that for the first time in the current Chinese liquidity crunch, Chinese importers, for now just those of soybeans and rubber but soon most other products, "are backing out of deals, adding to a wide range of evidence showing rising financial stress in the world's second-biggest economy."
The Banking Index reverses from its Cycle Top.
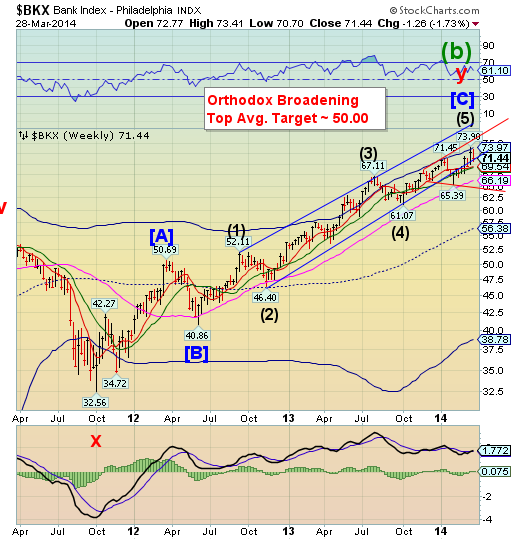
BKX reversed from its weekly Cycle Top this week at 73.97 and fell to its trading channel trendline. It has yet to break the lower trendline of its Orthodox Broadening formation with bearish consequences. The Cycles Model suggests a new low may be seen by mid-April, which heightens the probability of a flash crash.
ZeroHedge: Curious what the real, and not pre-spun for public consumption, sentiment on the ground is in a China (where the housing bubble has already popped and the severe contraction in credit is forcing the ultra wealthy to luxury real estate in places like Hong Kong) from the perspective of the common man? The photo below, which shows hundreds of people rushing today to withdraw money from branches of two small Chinese banks after rumors spread about solvency at one of them, are sufficiently informative about just how jittery ordinary Chinese have become in recent days, and reflect the growing anxiety among investors as regulators signal greater tolerance for credit defaults.
NYTimes: After the Cold War ended in the early 1990s, Viennese banks pushed aggressively into the newly open markets of Eastern Europe, as if rebuilding the old Hapsburg Empire one A.T.M. at a time.
The banks of Vienna were not the only Western lenders seeking to stake out the former Soviet bloc, of course. But the Austrians, for reasons of geography and history, bet big on Eastern Europe and Russia. Now, as regional tensions with Russia rise, Austrian banks risk being caught in the financial and geopolitical crossfire.
Reuters: St Petersburg-based Bank Rossiya is to cease all foreign currency operations and work only with the Russian rouble in response to U.S. sanctions imposed last week, it said in a statement on Friday.
Bank Rossiya is Russia's 15th-largest bank by assets, and the only Russian company that has so far been included on the list of individuals and entities sanctioned over Russia's annexation of Crimea, because of its close links to businessmen seen as personal allies of Russian President Vladimir Putin.
U.S. officials said that the bank would be "frozen out of the dollar".
ZeroHedge: While we are sure the governments and their IMF handlers will find a way around such annoyances as the rule of law, the Greek Supreme Court just ruled that the seizure of bank deposits due to debts to the state without previous notice was against the Constitution. We humbly suggest the Ukrainian courts be rapidly brought to a decision on the same ruling, before IMF hands start dipping into pockets.
Disclaimer: Nothing in this email should be construed as a personal recommendation to buy, hold or sell short any security. The Practical Investor, LLC (TPI) may provide a status report of certain indexes or their proxies using a proprietary model. At no time shall a reader be justified in inferring that personal investment advice is intended. Investing carries certain risks of losses and leveraged products and futures may be especially volatile. Information provided by TPI is expressed in good faith, but is not guaranteed. A perfect market service does not exist. Long-term success in the market demands recognition that error and uncertainty are a part of any effort to assess the probable outcome of any given investment. Please consult your financial advisor to explain all risks before making any investment decision. It is not possible to invest in any index.
