Get 40% Off
🤯 Perficient is up a mind-blowing 53%. Our ProPicks AI saw the buying opportunity in March.Read full update

Nikkei 225: 13,000 Holding On Technical Rebound

Published 06/06/2013, 05:59 AM
Updated 07/09/2023, 06:31 AM
Hourly Chart

N225

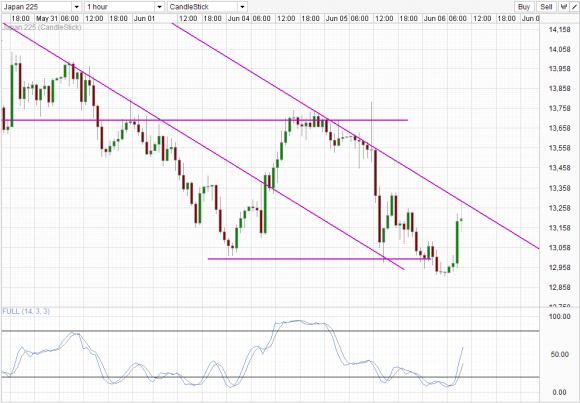
Nikkei Futures traded below 13,000 during US trading hours yesterday, being pushed by risk aversion flows which sent Dow Jones Index and S&P 500 to their largest daily loss since April 15. However, price did not spend long under 13,000, with a quick rebound during early Asian session sending price back above 13,250, only to be rebuffed by the descending trendline (or Channel Top if you prefer) which has been in play since 2 days ago. This rebound happened in spite of USD/JPY staying close to 99.0, and without any other fundamental news driver supporting higher stock prices. Looking across the East China Sea, Asian stocks aren’t doing well either, with Singapore’s Straits Time Index trading 1.09% lower, Hong Kong Hang Seng down by 0.78%, and Korea Kospi down by 1.52%. The Australian index is also trading lower at 0.64%, suggesting that risk trends are following in the direction of US stocks, which makes the rebound of N225 all the more peculiar.

This lead us to believe that current rally may simply be a short-term correction ala Tuesday’s recovery which was equally inexplicable. Prices has decline more than 3000 points from peak to trough, and indeed like what many Japanese Ministers have said recently – a correction following such strong moves is not surprising. It is rather ironic though, considering that they were referring to the current decline vis-a-vis the strong rally since November 2012.

From a technical point of view, current recovery rally is certainly not enough to break the bearish outlook. Furthermore, the “Spinning Top” candlestick suggest that price may reverse in the next few hours, in line with post lunch trade in Japan which tends to move in opposite direction of morning movements. If price manage to rally post lunch break, then the possibility of breaking the descending trendline becomes higher and the “spinning top” candlestick can be interpreted as a point of inflexion (a point where bulls take break) for an extension of current bullish correction.

3rd party Ad. Not an offer or recommendation by Investing.com. See disclosure here or remove ads .

Latest comments

Risk Disclosure: Trading in financial instruments and/or cryptocurrencies involves high risks including the risk of losing some, or all, of your investment amount, and may not be suitable for all investors. Prices of cryptocurrencies are extremely volatile and may be affected by external factors such as financial, regulatory or political events. Trading on margin increases the financial risks.
Before deciding to trade in financial instrument or cryptocurrencies you should be fully informed of the risks and costs associated with trading the financial markets, carefully consider your investment objectives, level of experience, and risk appetite, and seek professional advice where needed.
Fusion Media would like to remind you that the data contained in this website is not necessarily real-time nor accurate. The data and prices on the website are not necessarily provided by any market or exchange, but may be provided by market makers, and so prices may not be accurate and may differ from the actual price at any given market, meaning prices are indicative and not appropriate for trading purposes. Fusion Media and any provider of the data contained in this website will not accept liability for any loss or damage as a result of your trading, or your reliance on the information contained within this website.
It is prohibited to use, store, reproduce, display, modify, transmit or distribute the data contained in this website without the explicit prior written permission of Fusion Media and/or the data provider. All intellectual property rights are reserved by the providers and/or the exchange providing the data contained in this website.
Fusion Media may be compensated by the advertisers that appear on the website, based on your interaction with the advertisements or advertisers.
© 2007-2024 - Fusion Media Limited. All Rights Reserved.