Get 40% Off
👀 👁 🧿 All eyes on Biogen, up +4,56% after posting earnings. Our AI picked it in March 2024.
Which stocks will surge next?
Unlock AI-picked Stocks

Nifty: Repetitive Moves Seem Too Evident To Encourage Bears

Published 05/03/2017, 01:36 PM
Updated 07/09/2023, 06:31 AM

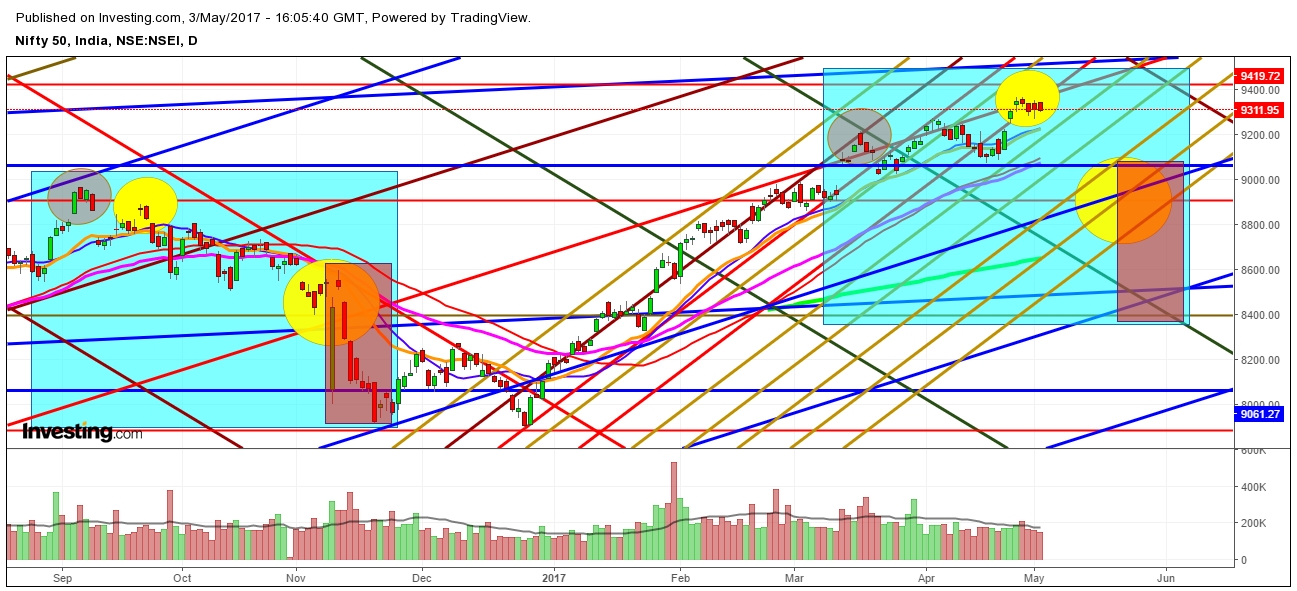
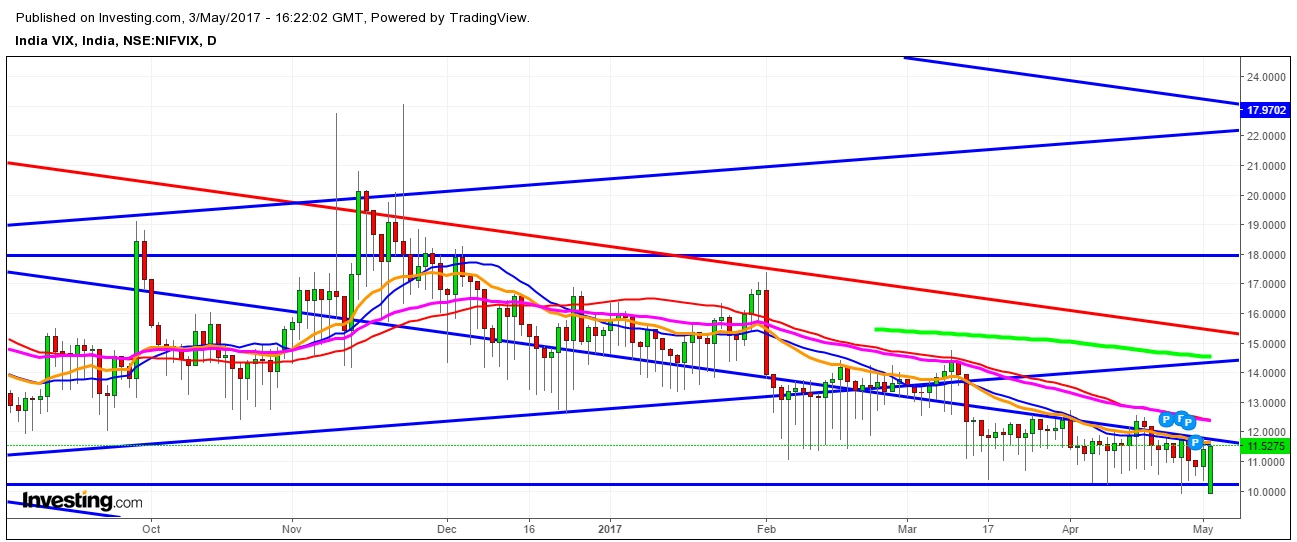
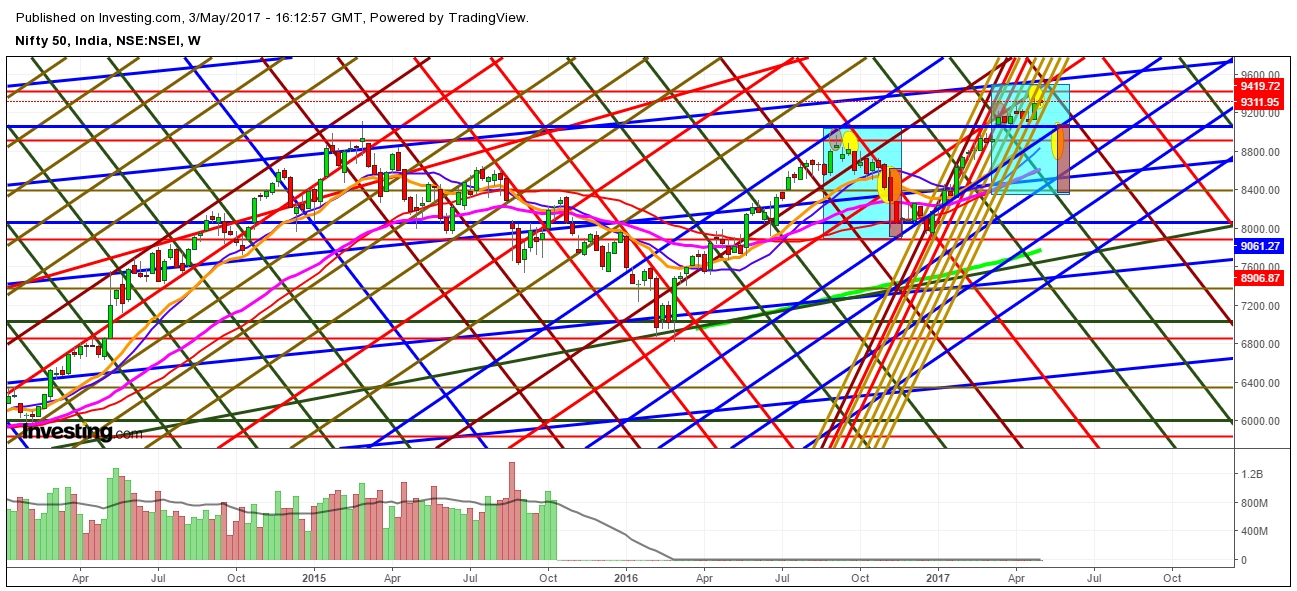
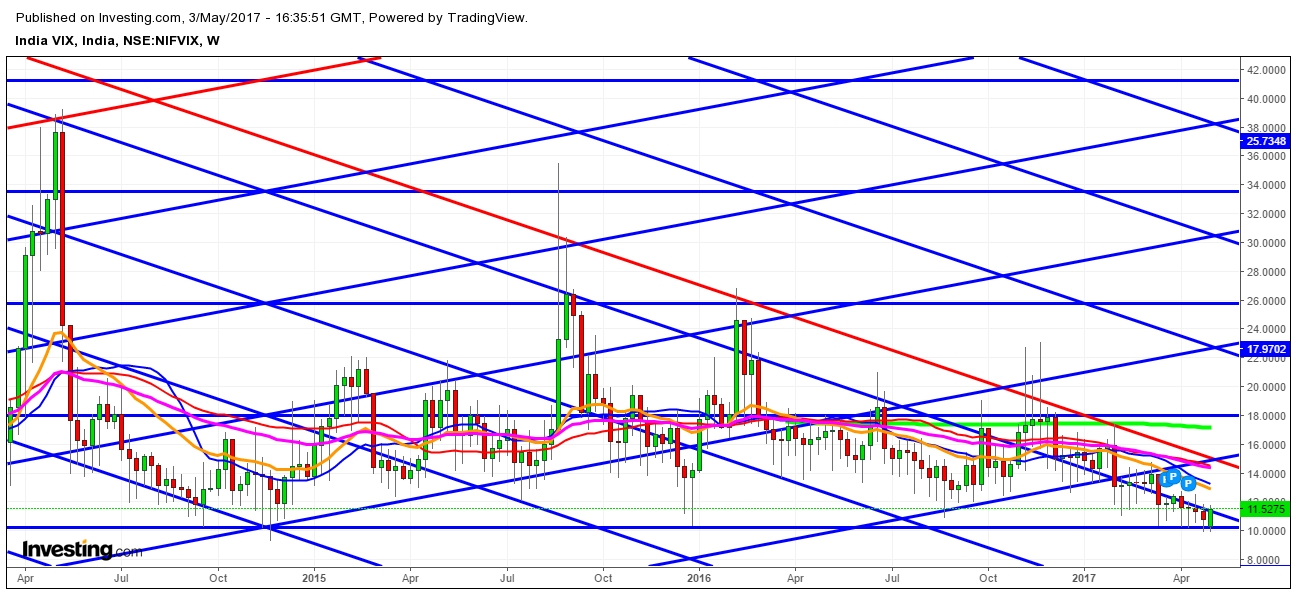
Nifty futures price movement indicates towards a repetitive move once again. If it happens, bears would definitely be in command. Secondly, Nifty Volatility Index seems ready to take a good bounce. Traders/ New Entrants must keep a watch over the movement of Nifty along with the Nifty VIX. I conclude that the silent movement of Nifty VIX during an uptrend in Nifty means a lot. Always remember too much rosy scenario always not going to be too red very soon.

Have look at the position of every single move in all the charts in different time zones and then only make a next move.

Have a Nice Trading Time.

Disclaimer: This analysis is purely based on the observations. I do not have any position in any Share or Nifty. One can create position in Shares of Nifty at his/her own risk. This analysis is only meant for investors’ education purpose.

Nifty Daily Chart

Nifty VIX Daily Chart


Nifty Weekly Chart

Nifty VIX Weekly Chart

Latest comments

29,Feb put or call plz tell me
tomorrow nifty call or put saide
jhaatu analyst
🤣
down bro 29feb nifty ok
next day position Nifty
tommorow nifty50 will bearish or bullish??
monday 11.20 nifty going bearish
are you a do nut
Good ofternoon sir Hi
hi sir
Nifty major support 15350 if it test then only market to remains down side,Bank Nifty Major support 34200
What you have written is very generic. When you are writing in a Forum & you are sharing your knowledge then you should be very specific in terms of numbers, how & why?? The security personnel of NSE/BSE can give a much better feedback than you. In future keep a note on it & then post to be "Singh is King".
This guy doesn’t know anything. Look at his chart haha. If hekneew something then he wouldnt waste his time here writing articles for Rs.5. What a loser.
You are right. He dont know anytging and only he understand his charts.
my own Analysis about nifty Spot
Nifty Spot Short covering expected 11258,,& 11298 try to short this level downside target 10966 sl 11380
still allowed to write?
https://www.investing.com/news/stock-market-news/stocks-rally-on-trade-progress-as-dollar-slips-markets-wrap-1741855
I think nifty will go below 10200 again till dec end
I feel nifty has strong resistance at 10700
what kind of complex charts are these? These are charts or abstract paintings
I feel nifty would be in range bound 10580 and low 10520
See basically if one observe DOW pattern, nifty has to follow within very short span. So when dow returned from 26700 to 23500, i.e. correction of about 15%, it has to be in Nifty too. i.e. it will come <9800. But as you know when people short, speculator long and therefore, it has come to 10700 from 10080 in last expiry. What I mean to say just refrain from long, if you can not short it. Be happy...... (Don't forget Most of midcap lost 50% from peak). One more thing, don't blame Modi Govt., as it is a result of global impact. Just follow what DOW does.......
Wow .. how do you read charts like that .. every single point and line can be interpreted in so many ways .. I wish the charts had points or lines of interest and everything else removed ! By the way what tool do you use ?? Is this Gann angles ?
Risk Disclosure: Trading in financial instruments and/or cryptocurrencies involves high risks including the risk of losing some, or all, of your investment amount, and may not be suitable for all investors. Prices of cryptocurrencies are extremely volatile and may be affected by external factors such as financial, regulatory or political events. Trading on margin increases the financial risks.
Before deciding to trade in financial instrument or cryptocurrencies you should be fully informed of the risks and costs associated with trading the financial markets, carefully consider your investment objectives, level of experience, and risk appetite, and seek professional advice where needed.
Fusion Media would like to remind you that the data contained in this website is not necessarily real-time nor accurate. The data and prices on the website are not necessarily provided by any market or exchange, but may be provided by market makers, and so prices may not be accurate and may differ from the actual price at any given market, meaning prices are indicative and not appropriate for trading purposes. Fusion Media and any provider of the data contained in this website will not accept liability for any loss or damage as a result of your trading, or your reliance on the information contained within this website.
It is prohibited to use, store, reproduce, display, modify, transmit or distribute the data contained in this website without the explicit prior written permission of Fusion Media and/or the data provider. All intellectual property rights are reserved by the providers and/or the exchange providing the data contained in this website.
Fusion Media may be compensated by the advertisers that appear on the website, based on your interaction with the advertisements or advertisers.
© 2007-2024 - Fusion Media Limited. All Rights Reserved.