
Summary
1. Nifty 50 index faces sideways trading amid uncertainty prior to the Lok Sabha elections.
2. Midcap and smallcap indices weaken, signaling potential liquidation from smaller segments.
3. Caution is advised for traders due to bearish divergence on the Nifty 50 chart, with support levels at 22,250 - 22,200 and 21,900 - 21,850 in case of correction.
The Indian benchmark Nifty 50 index has been struggling to keep up with the upside momentum for some time. Despite trading near an all-time high, the tug-of-war between bulls and bears is leading investors to doubt the sustenance of the ongoing rally.
On Tuesday, the index closed almost flat, after an action-packed session. The distance between today’s low and high is around 196 points which is enough to depict the intraday volatility. While day traders can easily make use of such moves, what should positional traders do?
Clearly, the market is trading sideways with no cues as to where it finally wants to go. Today’s closing is almost the same as the closing on 1 March 2024 depicting the range-bound movement since then. Hence, making a directional bet here might be quite risky due to conflict between the broader uptrend and short-term hiccups.
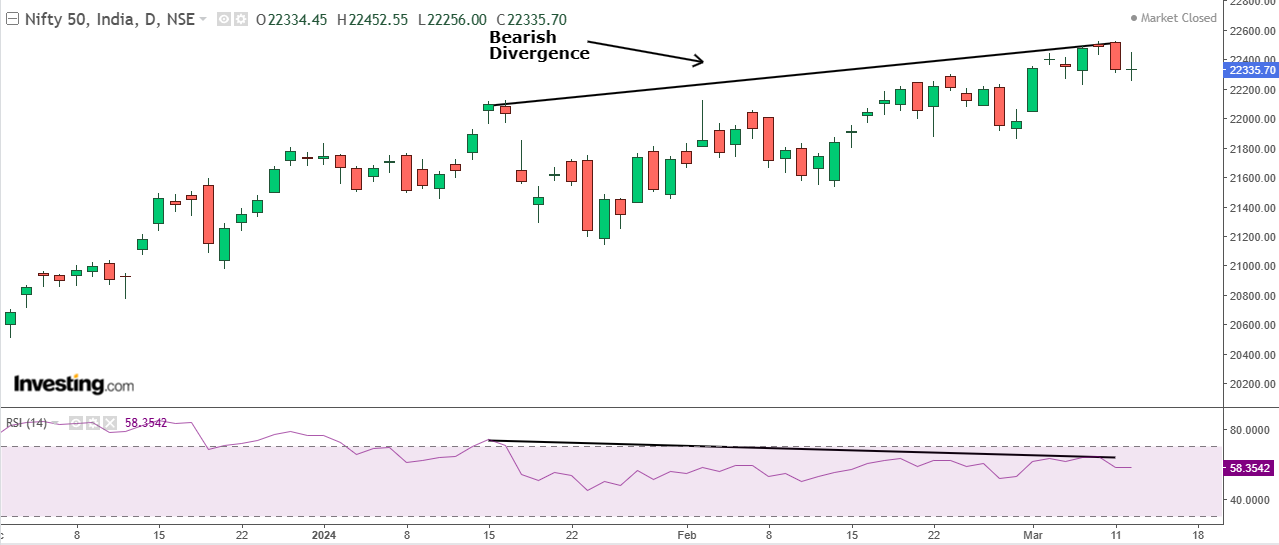
Image Description: Daily chart of Nifty 50 (spot)
Image Source: Investing.com
This kind of puzzling movement is expected to persist till the Lok Sabha elections in the coming few months. This was the situation of the large-cap index, but when looking at the small and midcap spaces, the pain is clearly visible.
The Nifty Midcap 100 index is down 1.41% to 48,086.85, while the Nifty Smallcap 100 index slid 1.98% to 15,092.1, which is the lowest closing since 23 January 2024. Hence, while the large caps are still holding their ground, liquidation from relatively smaller pockets is not hidden which might cascade down to the larger peers soon. Therefore, traders need to maintain caution, especially with their long positions.
Another worrisome signal for bulls is the formation of a bearish divergence on the Nifty 50 chart on the daily time frame. This divergence is an indication of a probable trend reversal and should not be ignored, especially around the top of the rally.
In case of a correction, the nearest support is present around 22,250 - 22,200. After this level, the index might slide to the next demand zone of 21,900 - 21,850.
-----------------------------------------------------------------
X (formerly, Twitter) - aayushxkhanna
LIMITED TIME OFFER: You can now avail InvestingPro for as low as 510/month. Click here to subscribe for 1 year and take your investment journey to the next level