The talk on the trading floors this morning centres on the limited moves in markets, although some will welcome this, notably the Fed who have had a hand in creating these conditions. The fact the S&P 500 managed an eight handle range and the Dow Jones index traded in a 70 point range testament to the lack of immediate catalysts. In fact, the range in the Dow equalled the lowest this year, with poor volume.
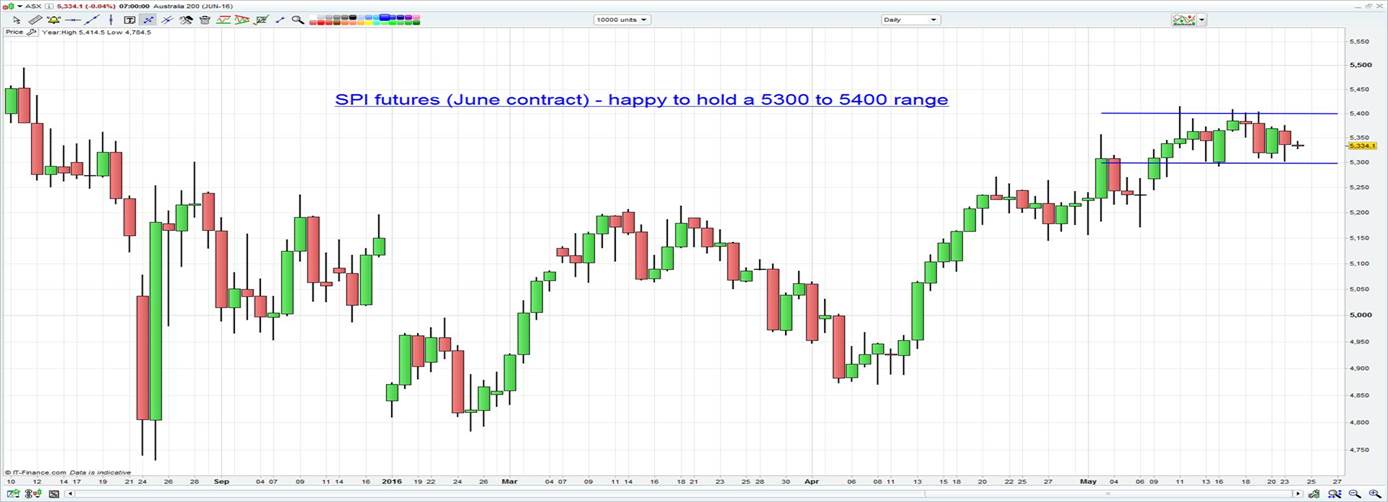
There may be life in these markets yet, but that will require the S&P 500 to break above the April downtrend at 2069, or close below the index floor at 2040. A break of these levels will promote moves in other developed markets and if we look at either the ASX 200 cash or SPI futures (June) we can see both markets very comfortable in a 5300 to 5400 range. AUD/USD needs a close below key support at $0.7210 for $0.7000 to come into play, while there is a large focus on EUR/USD requiring a closing break of strong support at $1.1210, which would have all sorts of ramifications for markets given the USD is at the epi-centre of all asset classes.

If we are talking levels then watch the US two-year treasury which at 90 basis points has its eyes on a potential move into the March highs of 100 basis points. That would be an outright USD positive and would represent a tightening of financial conditions. Some focus has also been on the US yield curve (2’s vs 10’s) moving to the flattest levels since 2008 overnight at 93 basis points. Some will say the bond market is flagging a US recession is coming, presumably based on a policy mistake from the Fed. I would caution on this view and feel this is more a reflection of investors within countries with high savings rates searching out yield.
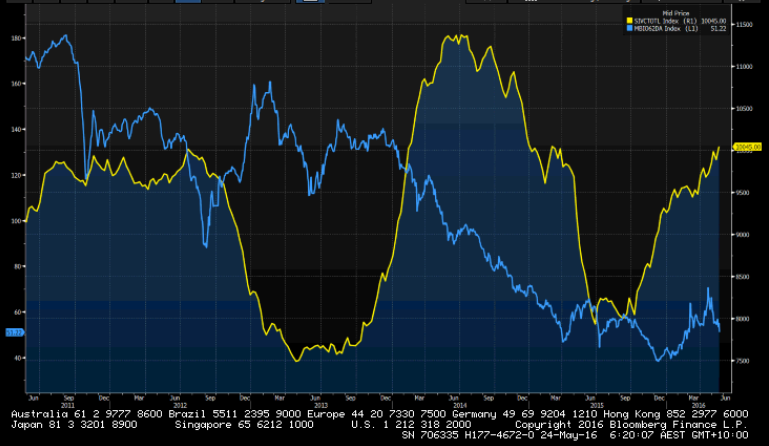
Our call today is for a modestly stronger open of 5325 (+0.1%) for the local market and despite iron ore (and any other commodities traded on the Shanghai commodity exchange) getting hit by over 6% BHP Billiton Ltd (NYSE:BHP) looks set for an open 1.5% higher. Further falls in iron and rebar futures can’t be ruled out as the trend is firmly lower and generally Chinese traders will act on the underlying trend in the market. The fact total stockpiles at ports have pushed back above 100 million tons (see Bloomberg chart below) has been a key reason behind the moves, although the inventory levels at small- and medium-sized mills actually fell last week. Still, this is one to keep an eye on and one would expect another day of strong volatility in these key commodities pushing AUD/USD through $0.7210 and through the figure. The USD is the dominant driver of the pair though and it’s worth highlighting that the fed funds future market has now priced in not just a full hike this year, but a 25% chance of a second rate hike from the Fed.
While markets may be flat for now, the saying goes ‘never short a dull market’. We live in interesting times and while sentiment is undoubtedly bearish (just going off my Twitter feed), price is delicately poised and could go either way. Let price guide.
Spot iron ore (Blue) vs Total port inventory levels

