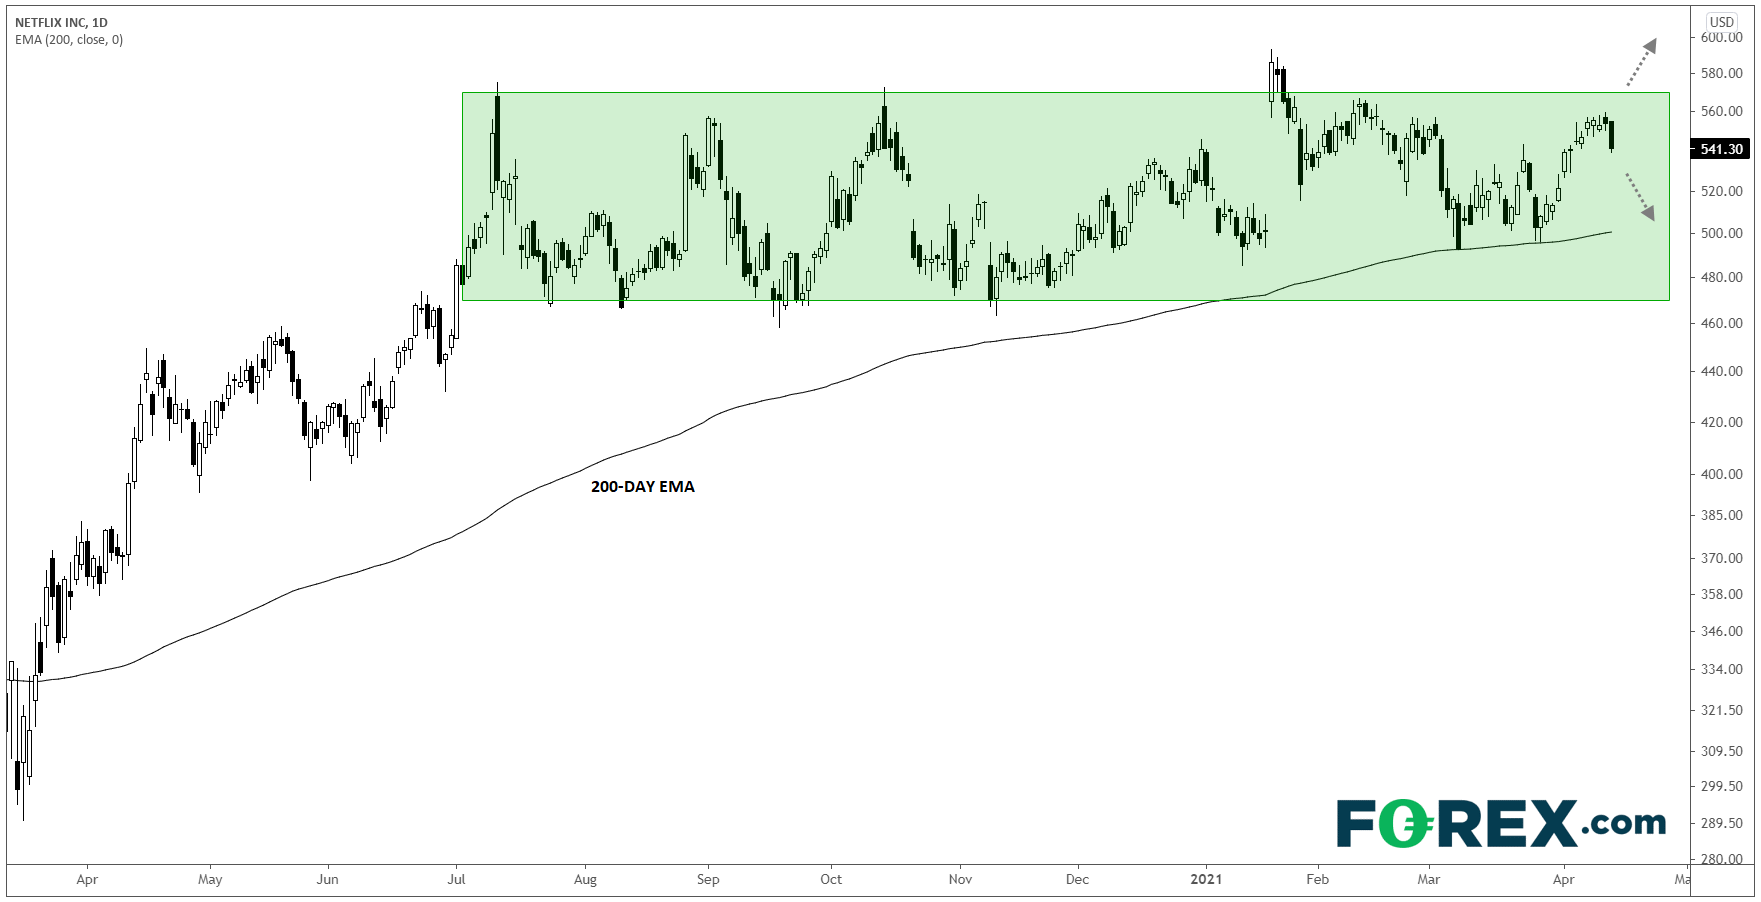
Sometimes trading doesn’t have to be hard: In retrospect, it’s obvious that Netflix (NASDAQ:NFLX) would be a big “winner” of the pandemic-driven lockdowns, and sure enough, the stock nearly doubled in four months off its late March low. Since then though, NFLX has been mostly treading water, with prices oscillating around the $500 level since the start of Q3 2020.
For traders bored of the relatively quiet share price, the company’s upcoming earnings report will be worth watching closely – see our rundown of the key facts and themes to know below:
When are Netflix earnings?
Tuesday, Apr. 20 after the closing bell.
Netflix earnings expectations
$2.98 in EPS on $7.13B in revenues in Q1.
What to watch from Netflix earnings
As always with Netflix, one of the biggest storylines will be subscriber growth. In Q4, the firm reported nearly 204M global subscribers, a gain of 8.5M over the previous quarter. This quarter, the company has indicated that it expects to add 6M subscribers, though analysts believe that the company may be attempting to “under-promise and over-deliver” and that subscriber growth could be closer to the previous quarter’s 8.5M figure.
Another key financial figure to watch will be free cash flow. Executives have indicated that they anticipate free cash flow to come in near breakeven this year, with an expected flip to positive FCF in 2022 paving the way for eventual share repurchases. That said, the streaming wars continue to heat up (Disney+ recently reported more than 100M subscribers), Netflix may be forced to continue to pay more to develop top-tier original content in the coming months. Any hints of another subscription price increase or further crackdowns on password sharing could offset higher production costs.
Netflix technical analysis
As we noted earlier, Netflix has spent nearly three full quarters in a broad consolidation range between $470 and $570. While this performance has lagged the broader markets and some of the company’s “big tech” rivals, it has allowed the stock to digest its impressive Q2 2020 rally and correct through time, rather than an outright price decline. The stock’s 200-day EMA has “caught up” with price and provided strong support around the $500 level on two occasions last month.

If the company is able to exceed analyst expectations for its results and issue optimistic guidance for the rest of the year, the stock could finally break out of its prolonged consolidation range to new record highs and potentially make a run at the $600 level. On the other hand, a weaker-than-anticipated earnings report could drive shares back down toward the aforementioned 200-day EMA near $500.
