
Shares of NetApp Inc. (NASDAQ:NTAP) declined more than 4% on May 22, after the company reported dismal fiscal fourth-quarter 2019 results and issued soft guidance for first-quarter fiscal 2020.
The company reported non-GAAP earnings of $1.22 per share, missing the Zacks Consensus Estimate by 3 cents. However, the figure improved 16.2% from the year-ago period. Nonetheless, earnings came in towards the lower end of management’s guided range of $1.22 and $1.28 per share.
NetApp anticipates non-GAAP earnings for first-quarter 2020 between 78 cents and 86 cents per share. The figure lags the Zacks Consensus Estimate of $1.04.
Moreover, net revenues for first quarter are anticipated to be in the range of $1.315-$1.465 billion, which also misses the consensus mark of $1.51 billion. Management anticipates revenues to be impacted by more than a point of exchange rate fluctuations.
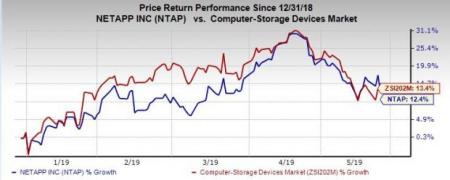
Notably, NetApp stock has returned 12.5% on a year-to date basis, underperforming the industry’s rally of 13.4%.
Quarter in Detail
Revenues of $1.592 billion were down 3% from the year-ago quarter and lagged the Zacks Consensus Estimate of $1.647 billion. The reported figure was near the lower end of the guided range of $1.59-$1.69 billion. The year–over-year decline included more than two points of exchange rate fluctuations.
Product revenues (62.8% of total revenues) decreased 2.5% year over year to $1 billion owing to currency headwind.
Management noted that the combined revenues of Software maintenance and Hardware maintenance amounted to $526 million, decreasing 3% from the year-ago quarter.
Individually, software maintenance revenues (15.2%) came in at $242 million, down 3.4% year over year. Hardware maintenance and other services revenues (22%) were $350 million, declining 8.6% from the year-ago quarter.
Geographically, Americas, EMEA and Asia Pacific accounted for 57%, 29% and 14% of total revenues, respectively.
It is to be noted that uncertain macroeconomic environment and currency headwinds limited revenue growth and margin expansion. However, sturdy product adoption, increasing deal wins, and expanding customer base across varied geographies aided the results.
Moreover, the company is benefiting from transition to data fabric strategy (a software-defined approach to data management).
Further, NetApp witnessed increased momentum of its hyper-converged infrastructure (HCI) solutions from enterprises undergoing digital transformation. In fact, the company’s HCI is anticipated to act as a catalyst for the top line in the long run. Expanded new cloud partnerships and open source projects were other notable factors.
NetApp anticipates benefiting from increasing adoption of all-flash arrays. Notably, the company gained in all-flash arrays market with business increasing 25% year over year.
The company expects to benefit from the market transition from traditional IT infrastructure to private cloud architecture on the back of NetApp ACI and SolidFire.
Further, increasing allegiance to adoption of hybrid cloud from an on-premises infrastructure is expected to favor NetApp’s financial performance, going ahead.
During the fourth quarter, the company’s all-flash array business surged 11% on a year-over-year basis. Its annualized net revenue run rate was $2.7 billion. The cloud data services recorded a run-rate of $51 million.
The company’s expertise in the flash array market is aiding its popularity in storage area network (SAN) and converged infrastructure markets.
Operating Details
Non-GAAP gross margin was 65.2%, which expanded 190 bps from the year-ago quarter. The higher-than-expected gross margin expansion came on the back of higher product gross margin of 55.3% which expanded 260 bps.
Further, product margin expansion was aided by growth in software products and approximately $30 million contribution from Enterprise License Agreement (ELA) agreements.
Software maintenance gross margin of 95.9% contracted 150 bps on a year-over-year basis. Meanwhile, Hardware maintenance and other services gross margin expanded 130 bps to 72.3%.
Non-GAAP operating expenses were flat year over year and came in at $680 million.
Consequently, non-GAAP operating margin expanded 60 bps on a year-over-year basis to 22.5%.
Balance Sheet & Cash Flow
NetApp exited the quarter ending Apr 26, 2019, with $3.89 billion in cash, cash equivalents and investments compared with previous quarter of $4.05 billion. Long-term debt (including current portion) came in at $1.544 billion compared with $1.543 billion in the previous quarter.
The company generated net cash from operations of $399 million during the reported quarter compared with $451 million in the previous quarter.
Free cash flow during the fourth quarter came in at $364 million compared with $420 million in the previous quarter.
Further, the company repurchased shares worth $500 million and paid $97 million as dividends in the reported quarter.
NetApp announced an increase of 20% quarterly cash dividend of 48 cents per share.
Fiscal 2019 Highlights
Revenues of $6.15 billion were up 4% year over year in fiscal 2019. The company reported non-GAAP earnings of $4.52 per share as compared with $3.52 per share reported in fiscal 2018.
In fiscal 2019, the company returned $2.51 billion to shareholders in the form of share repurchases and cash dividends.
Notable Developments
NetApp is increasingly focused on strengthening its hybrid cloud domain with new capabilities. The company announced OnCommand Workflow Automation 5.0 which aid users in maintaining, and monitoring the on-premise and cloud storage workflow
Moreover, in the reported quarter, NetApp announced solutions to enable customers to deliver data-driven business outcomes for applications across hybrid cloud and multicloud environments. These include FlexPod AI platform; FlexPod for MEDITECH software; NetApp Service Level Manager; and the FlexCache.
NetApp Memory Accelerated Data extended alliance with Intel (NASDAQ:INTC)'s Optane DC persistent memory solution to aid users to upscale workloads and process huge amounts of data faster in a secure architecture.
NetApp recently entered into a strategic partnership with H2O.ai. Per the deal, NetApp Cloud Volumes Service will be combined with H2O Driverless AI to deliver AI related demands of businesses.
Notably, at the Google (NASDAQ:GOOGL) Cloud Next 2019 Partner Summit, NetApp was named as “2018 Google Cloud Technology Partner of the Year for Infrastructure.” The company was also honoredas “Brand of the Year” by Think Global Awards.
Guidance
For first quarter of fiscal 2020, NetApp expects non-GAAP gross margin to be 65% and non-GAAP operating margin to be in the range of 17-18%.
For fiscal year 2020, NetApp anticipates net revenues to grow at the low end of mid-single-digit range, primarily owing to robust private cloud business and cloud data services as solutions on Azure.
NetApp is anticipated to benefit from ongoing transition to all-flash array solutions, strengthening hybrid cloud based solutions and synergies from SolidFire.
The company anticipates gross margin to be in the range of 64-65%% and operating margin to be approximately in the band of 23-24%.
Zacks Rank & Stocks to Consider
NetApp carries a Zacks Rank #3 (Hold).
Some better-ranked stocks in the broader technology sector are Cirrus Logic, Inc. (NASDAQ:CRUS) , Universal Display Corporation (NASDAQ:OLED) and Match Group, Inc. (NASDAQ:MTCH) , each sporting a Zacks Rank #1 (Strong Buy). You can see the complete list of today's Zacks #1 Rank stocks here.
Cirrus Logic, Universal Display and Match Group have a long-term earnings growth rate of 15%, 30% and 15.15%, respectively.
Wall Street’s Next Amazon (NASDAQ:AMZN)
Zacks EVP Kevin Matras believes this familiar stock has only just begun its climb to become one of the greatest investments of all time. It’s a once-in-a-generation opportunity to invest in pure genius.
NetApp, Inc. (NTAP): Free Stock Analysis Report
Match Group, Inc. (MTCH): Free Stock Analysis Report
Cirrus Logic, Inc. (CRUS): Free Stock Analysis Report
Universal Display Corporation (OLED): Free Stock Analysis Report
Original post
Zacks Investment Research