Optoelectronics products maker NeoPhotonics (NYSE:NPTN) stock was punished by wide losses and lowered guidance but may be finding a bottom. The Company makes optical transceivers, switches, and coherent transmission products for 100G to 400G applications. Unfortunately, the U.S and global trade sanctions against its top customer, China’s Huawei has been the source of major disruption and operational losses.
The Company has projected a return to profitability by 2H 2021, however, critics are wary of these prospects especially with the global semiconductor shortage. The shortage in chips muted Q1 sales by (-$5 million) as its higher-end higher-margin products bears most of the impact. Further cause for worry is the muted demand for 5G deployment in western markets notably after the massive U.S. 5G wireless spectrum auctions. With all these negatives, the expectations remain low despite the powerful 5G, infrastructure, and bandwidth tailwinds expected to ramp up in the latter half of 2021. Prudent investors can watch for opportunistic pullback levels on this beaten-down optics play to consider scaling into a position.
Q1 Fiscal 2021 Earnings Release
On April 29, 2021, NeoPhotonics reported its fiscal Q1 2021 results for the quarter ending Mar 2021. The Company reported an earnings-per-share (EPS) loss of (-$0.15) versus (-$0.17) consensus analyst estimates, a $0.02 beat. Revenues fell (-37.5%) year-over-year (YoY) to $60.9 million, beating analyst estimates for $59.94 million.
The revenue plunge was attributed to the trade sanctions with Huawei and chip shortage. Product revenues for 400G and higher applications grew 134% YoY. NeoPhotonics CEO, Time Jenks, stated:
“NeoPhotonics again delivered strong results in the first quarter, as we transition our business to cloud-centric. We demonstrated transmission of 400G data rates over 800 km using out 400ZR+ coherent modules. We are excited about the prospects these modules are demonstrating for the next generation of highest speed distance interconnects.”
The Company ended the quarter with $111 million in cash and short-term investments.
Lowered Q4 Fiscal 2021 Guidance
NeoPhotonics cut its Q2 fiscal 2021 EPS range to be a loss of (-$0.30) to (-$0.20) versus (-$0.12) consensus analyst estimates. Revenues estimates were lowered to come in between $59 million to $65 million versus $66.68 analyst estimates.
Conference Call Takeaways
CEO Jenks set the tone:
“Demand for NeoPhotonics highest speed products, including ultra-pure light tunable lasers and 64 gigabaud modulators and receivers remain strong, with accelerating market adoption and deployment and related market share gains at the 400 gigabits per second and beyond, especially for links requiring the highest speed over distance.”
He noted that cloud and data center demand have made these highest-speed deployments one of the fastest growth areas in the industry. This segment comprised of 74% of total revenues with four 10% customers. While demand for 400 gig is in the early innings, the Company is well positions for 600 gig and 800 gig speeds driving the next wave of growth.
Calm Before the Storm?
Near-term demand in western markets have been dampened in metro and regional deployments. China Mobile (NYSE:CHL) businesses were also light. “In sum, taking the U.S. and China markets together, demand in the current period is soft overall. We anticipate this will change in the second half as major global carriers increase their deployment rates as the pandemic subsides, and as hyperscalers being to roll out initial 400ZR installations.”

NPTN Opportunistic Pullback Levels
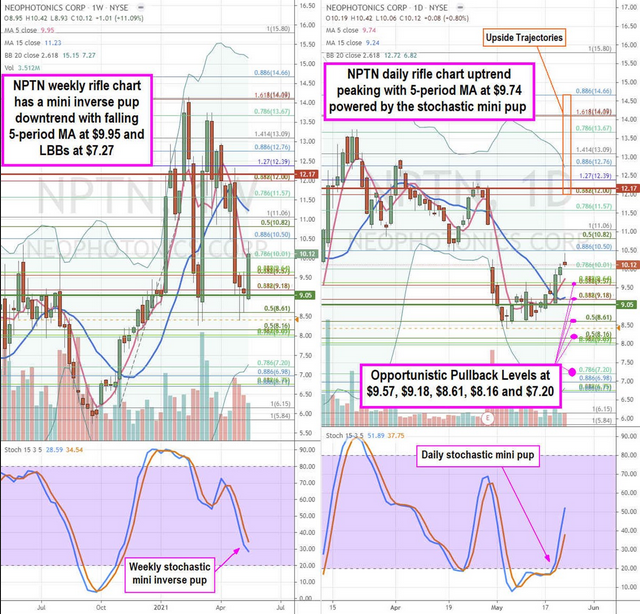
Using the rifle charts on the weekly and daily time frames provides a precision view of the landscape for NPTN stock. The weekly rifle chart formed a mini inverse pup breakdown with a falling 5-period moving average (MA) resistance at $9.95 and weekly lower Bollinger Bands (BBs) near the $7.20 Fibonacci (fib) level. The weekly 5-period MA is testing as the daily rifle chart reversed into an uptrend on the bullish stochastic mini pup.
The daily rifle chart breakout has a rising 5-period MA at $9.74 with upper BBs at the $12.74 fib. The uptrend triggered on the breakout through the daily market structure low (MSL) above $9.05. However, a shooting star daily candle may set up another market structure high (MSH) below the prior MSH on the $12.17 trigger. Prudent investors can patiently monitor for opportunistic pullback levels at the $9.57 fib, $9.18 fib, $8.61 fib, $8.16 fib, $56.58 fib, and the $7.20 fib. Upside trajectories range from the $12 fib up to the $14.66 fib level. Keep an eye on peers LITE and IIVI as these photonic stocks tend to move together.
