The fear and uncertainty that has swept the world over coronavirus have been causing wild gyrations in markets across all asset classes. We have reached a point where price variance in markets is at the same level as during the 2008 global financial crisis. A dozen years ago, the U.S. housing and mortgage-backed securities markets, together with European sovereign debt, triggered the debacle in markets. The current environment comes as a virus that began in China in January is spreading around the world, causing fear and uncertainty to mount in markets across all asset classes.
On March 6, the international oil cartel OPEC exacerbated the situation when it refused to address the demand destruction with additional production cuts. Saudi Arabia decided to flood the market with the energy commodity, causing the price of oil to drop like a stone to a level not seen since February 2016 at $27.34 per barrel. Risk-off can cause markets to move to levels that seem illogical. When it comes to natural gas, bearish sentiment caused by inflated inventories and a warmer-than-average winter season has kept pressure on the price of the energy commodity since early November. On the first day of this week, price fell to the lowest level of the century when it traded to a low of $1.61 per MMBtu.
Meanwhile, the price was knocking on the door at the $2 level on March 11, while other markets were collapsing. The Energy Information Administration released its latest withdrawal data on March 12, as the price moved back to the $1.80 level. Risk-off conditions have been bullish for natural gas, given the number of shorts in the market. The United States Natural Gas Fund (NYSE:UNG) replicates the price action in the nearby NYMEX natural gas futures contract.
The Market Expected A Decline Of 68 BCF
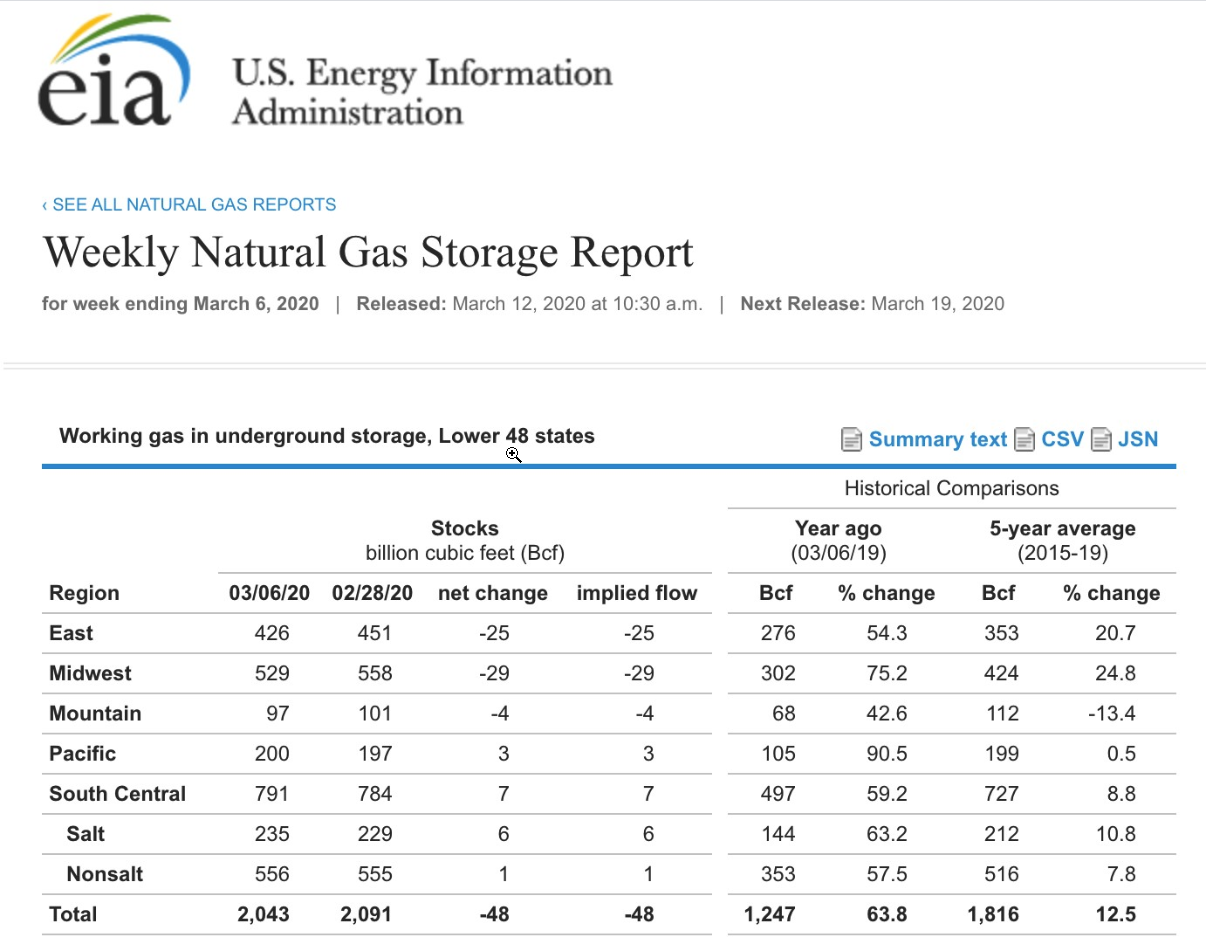
The EIA told markets that natural gas inventories fell by only 48 billion cubic feet for the week ending on March 6.

(Source: EIA)
As the chart highlights, total stockpiles were at 2.043 trillion cubic feet on March 6, 63.8% above last year’s level, and 12.5% above the five-year average for this time of the year. The withdrawal came in below expectations, but it did not push the price of natural gas back to the lows from the start of the week.
Fundamentals Remain Bearish
Supply and demand fundamentals in the natural-gas market continue to support lower prices. With only two weeks to go in the peak season of demand when stockpiles decline, the inventories will wind up around the 1.9 trillion cubic feet level going into the injection season. Last year, stocks bottomed at 1.107 tcf. Meanwhile, the price of crude oil has tanked and risk-off has gripped stocks and markets across all asset classes. While the trend in natural gas has been lower since November 2019, and the price dropped to its lowest level since 1998 on March 9, the current environment is pushing the price of natural gas higher.

(Source: CQG)
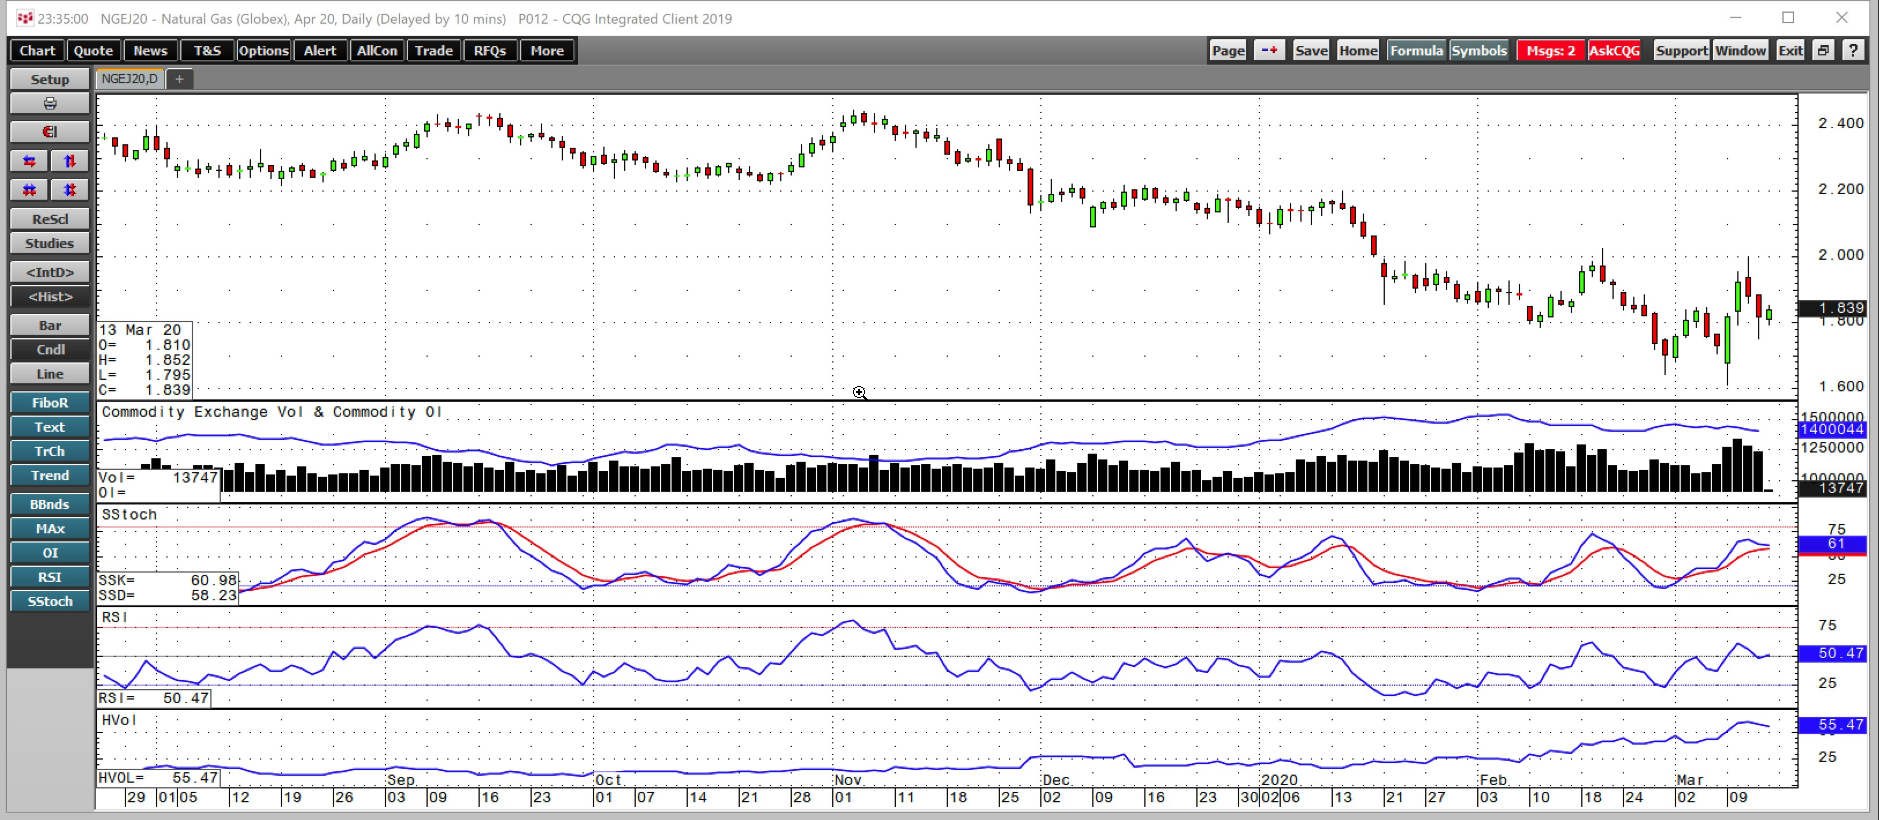
The chart above shows that the open interest metric has been trending lower as the price rose over recent sessions. An overabundance of speculative short positions was likely responsible for the move to a high of $1.998 this week. However, sellers reappeared at just shy of $2 and pushed the price back down to the $1.85 level. Price momentum and relative strength indicators were just over neutral readings. Daily historical volatility at over 55% reflects the wider trading ranges in the energy commodity over recent sessions.
Risk-Off Lifts Price With 2 Weeks Left In Withdrawal Season
Natural gas likely rallied because the carnage in other markets caused some of the market participants holding speculative short positions to cover their risk. Natural gas appeared headed for lows below the 1998 bottom, but the price put in a bullish reversal on March 9 and rallied by almost 30 cents or over 24% in just three sessions.
We will go into the injection season with around 1.9 tcf in storage. At the same rate of stockpile increases in 2020, as we witnessed in 2019, stocks could rise to well over four tcf and a new record high. However the ongoing financial crisis that has decimated oil and gas companies could mean that production will fall dramatically. Gas companies may not only lower their output, but many could go kaput as debt-laden firms will face bankruptcy over the coming weeks and months. Risk-off may have lifted the price of natural gas from the lowest price of this century on March 9, but it also may keep the bullish party going in the months ahead if output suffers alongside the oil and gas companies.
The United States Natural Gas Fund L.P. (UNG) was trading at $14.67 per share on Friday morning, up $0.47 (+3.31%). Year-to-date, UNG has declined -37.09%, versus a -4.70% rise in the benchmark S&P 500 index during the same period.
UNG currently has an ETF Daily News SMART Grade of C (Neutral), and is ranked #51 of 109 ETFs in the Commodity ETFs category.
