
Last Thursday, the price of natural gas was looking like it was on a path to a new low. In late March, the price of the energy commodity traded to a low of $1.519 per MMBtu, the lowest level in a quarter of a century. At below the $1.60 level on Thursday, April 15, the price was within striking distance on the recent bottom. Below the March low, the next technical support levels in the natural gas futures market stand at $1.335 and $1.25 per MMBtu, the lows from 1992. The all-time bottom since natural gas began trading on the NYMEX division of the CME came in 1992 at $1.02 per MMBtu. However, the energy commodity put in a bullish reversal on the daily chart on April 16, sending the price back to just over the $1.80 level on April 17.
The current environment in the oil and gas markets reflects the level of demand as the U.S. and global economies have ground to a halt. Social distancing guidelines and instructions to remain at home for all but essential workers have caused energy demand to plunge. The longer coronavirus causes a self-induced coma in the economy, the lower energy prices could decline. Last week, an unprecedented 9.7-million-barrel-per-day reduction in output from OPEC, Russia, and other world producers did not stop the price of crude oil from probing below the $17.50 per barrel for the first time since 2001. Natural gas could face the same fate in the short term as a move below the $1.50 per MMBtu level would be just another lower low and a continuation of the pattern over the past six months. Natural gas avoided that fate late last week.
A bullish reversal on the daily chart stops the downward trajectory, for now
On Thursday, April 16, the natural gas market looked like it was heading for a test of the lows and levels below the $1.50 per MMBtu level.
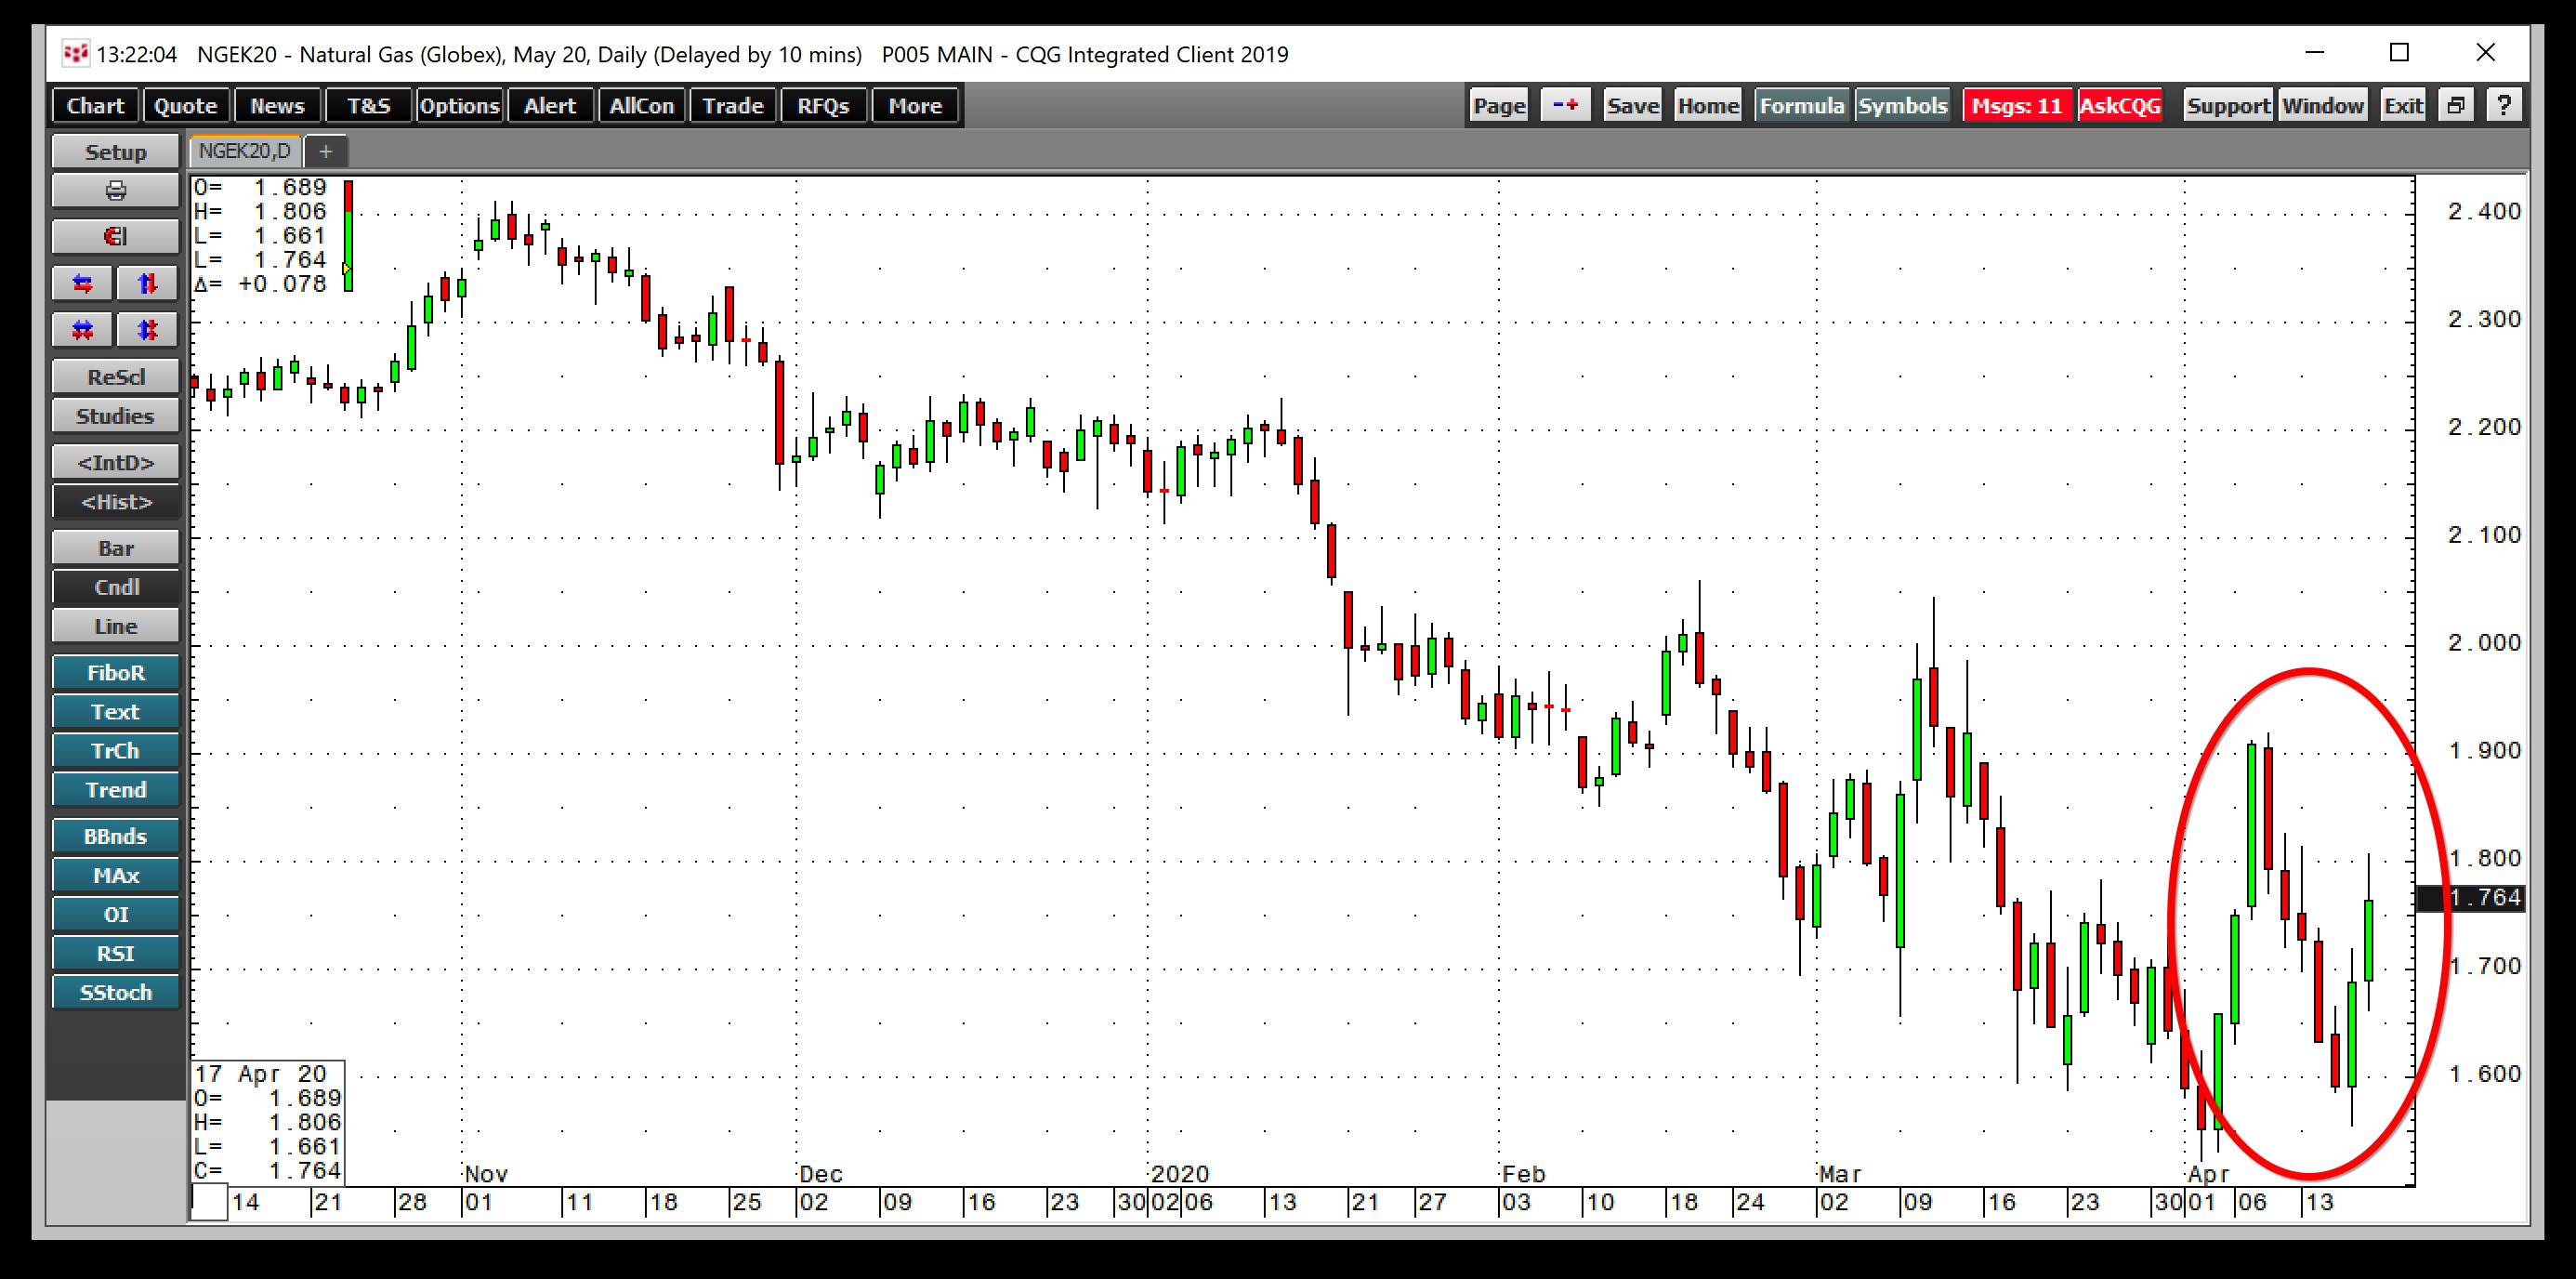
(Source: CQG)
The daily chart shows that after five consecutive sessions of price declines that took the price of May futures from $1.918 on April 8 to a low of $1.555 on April 16, the price turned higher and put in a bullish reversal pattern. Natural gas followed through on the upside on April 17, as the price rose to $1.806 per MMBtu and settled around the $1.75 level. The rally in natural gas was impressive considering nearby crude oil futures fell to a low of $17.31 per barrel, the lowest price since 2001 last Friday. The price action temporarily stopped the downward trajectory in the market, but the pattern of lower highs remained intact at the end of last week. Natural gas would need to rise above the $1.918 level to end the bearish trend. Above there, technical resistance stands at the mid-March high of $2.044 and the mid-February peak at $2.06 per MMBtu on the active month May contract.
The forward curve is telling us that production will decline, and prices will rise
The forward curve in natural gas is in a steep contango, which is a sign of a condition of oversupply in the market.
(Source: NYMEX/RMB)
The forward curve in natural gas illustrates that the price differential for delivery of the energy commodity in May 2020 compared with January 2021 stood at $1.175 per MMBtu at the end of last week. While seasonal factors account for some of the price differential, the 67% contango reflects a glut condition in the market.
As of April 10, stockpiles of natural gas were 71.7% above the previous year’s level and 21.4% higher than the five-year average for this time of the year. The stocks sitting in storage across the United States may continue to keep the bearish trading pattern intact over the coming days and weeks. While natural gas recovered from a higher low last week, selling has emerged on each attempt at a rally since November 2019.
Meanwhile, the forward curve is also signalling that production is likely to decline. Debt-laden producers in the oil and gas sector are on the verge of bankruptcy in the current environment, which could lead to a far lower level of inventory gains over the coming months.
Contango makes investments expensive, pick your spots with caution
Demand continues to weigh on oil and gas prices, sending them to the lowest levels in years. The bearish carnage in the energy sector continued last week. When it comes to natural gas, the latest rally was likely on the back of speculative short covering.
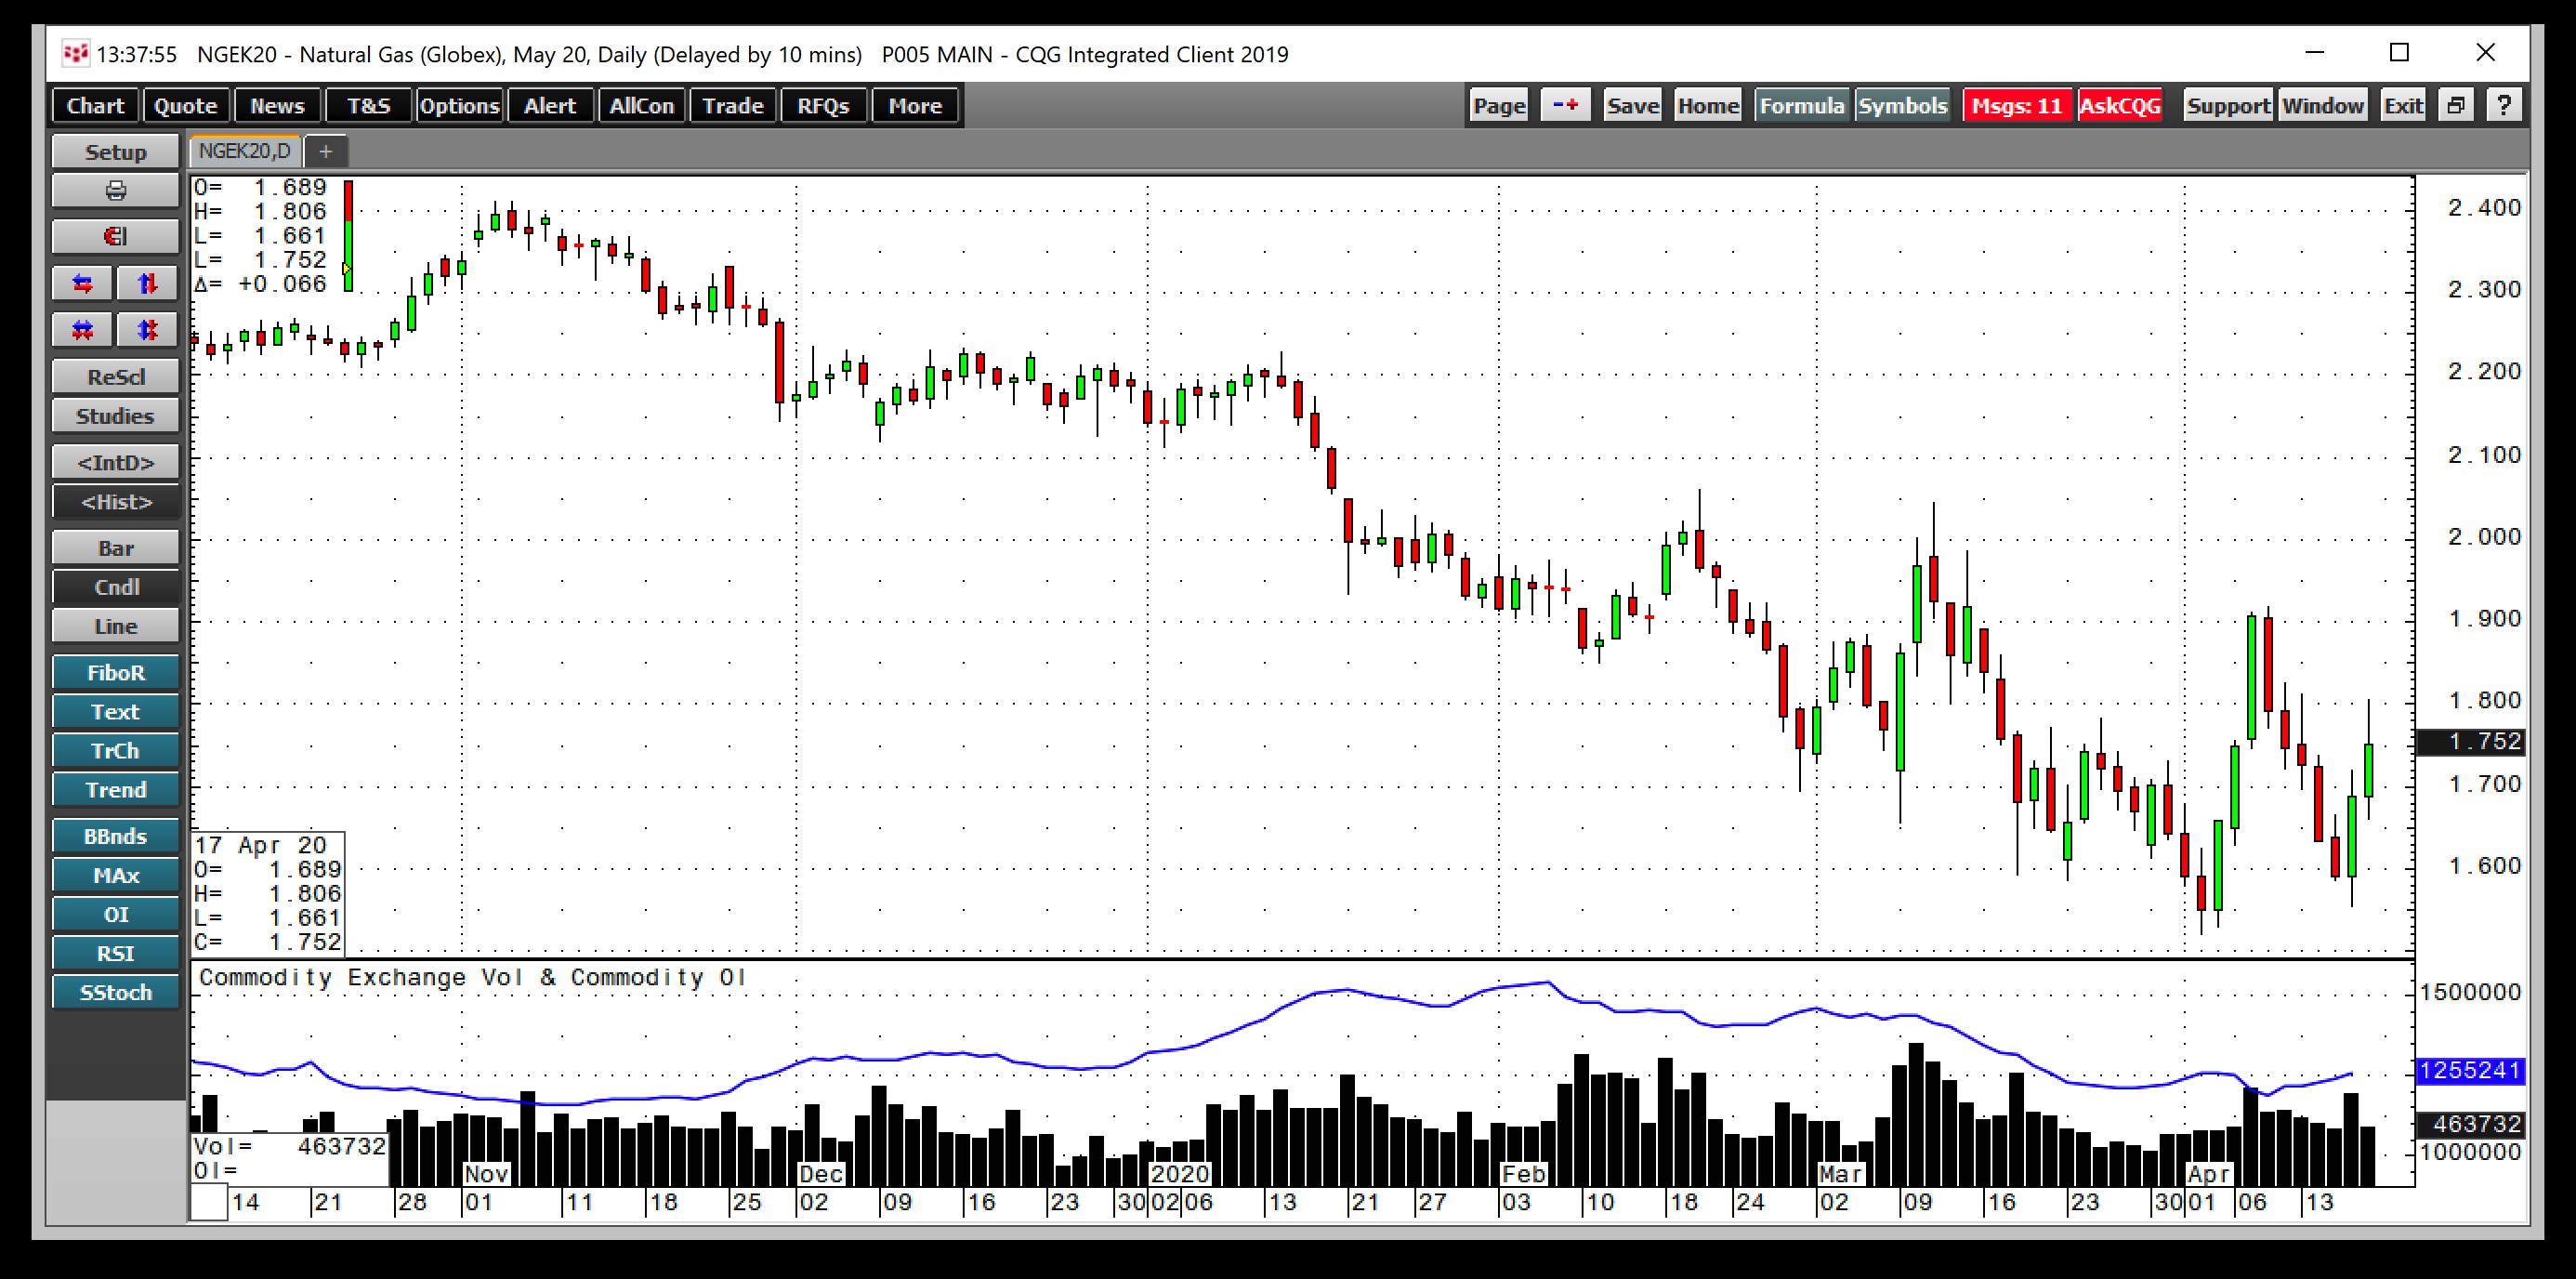
(Source: CQG)
The daily chart shows that the total number of open long and short positions rose from 1.186 million contracts on April 8 when natural gas was over the $1.90 level to 1.255 million contracts on April 16 when the price hit the latest bottom at $1.555 per MMBtu. Speculative shorts looking for a new low likely scrambled to exit risk positions as the price turned higher on April 16 and followed through on the upside on April 17.
If production is going to decline in the natural gas market, we could see higher nearby prices later this year. However, the high level of contango in the market makes a medium or longer-term investment in natural gas prohibitive. Therefore, trading instead of investing is likely to be the optimal approach to the natural gas market. Pick spots carefully in the current environment and use tight stops that reflect a logical balance when it comes to risk versus reward factors. If the current pattern remains intact, natural gas will find another lower high below the $1.918 level and return for a test of the lows. The trading ranges have been wide enough to capture attractive profits for nimble traders with their fingers on the pulse of the volatile futures market.
Next winter is a long way off and capturing small gains instead of positioning for a significant move is a way to control risk and build profits over the coming weeks and months.
On April 20, while oil was plunging, natural gas quietly traded above $1.918, breaking above the recent high and ending the pattern of lower peaks.