Get 40% Off
👀 👁 🧿 All eyes on Biogen, up +4,56% after posting earnings. Our AI picked it in March 2024.
Which stocks will surge next?
Unlock AI-picked Stocks

Natural Gas - Bears' Cocoon Covet To Explode

Published 02/18/2018, 02:11 AM
Updated 07/09/2023, 06:31 AM

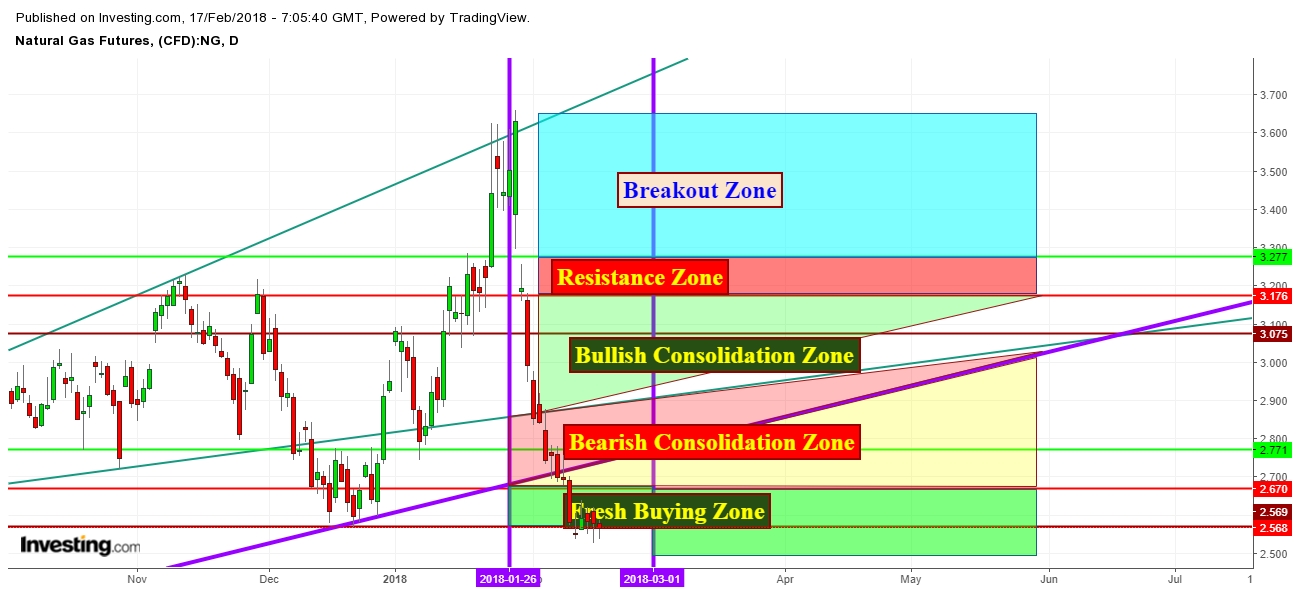
Since the submission of my last analysis, I find that Natural Gas Futures has been witnessing bouts of short-covering-small-rallies since the announcement of natural gas inventory from the level of $2.540 – a level where the Natural Gas bears are forced to cover their shorts before the bulls start fire works during the week of February 18th, 2018.

Observations

Natural Gas Futures Price Daily Chart - Evidence Of Fresh Buying

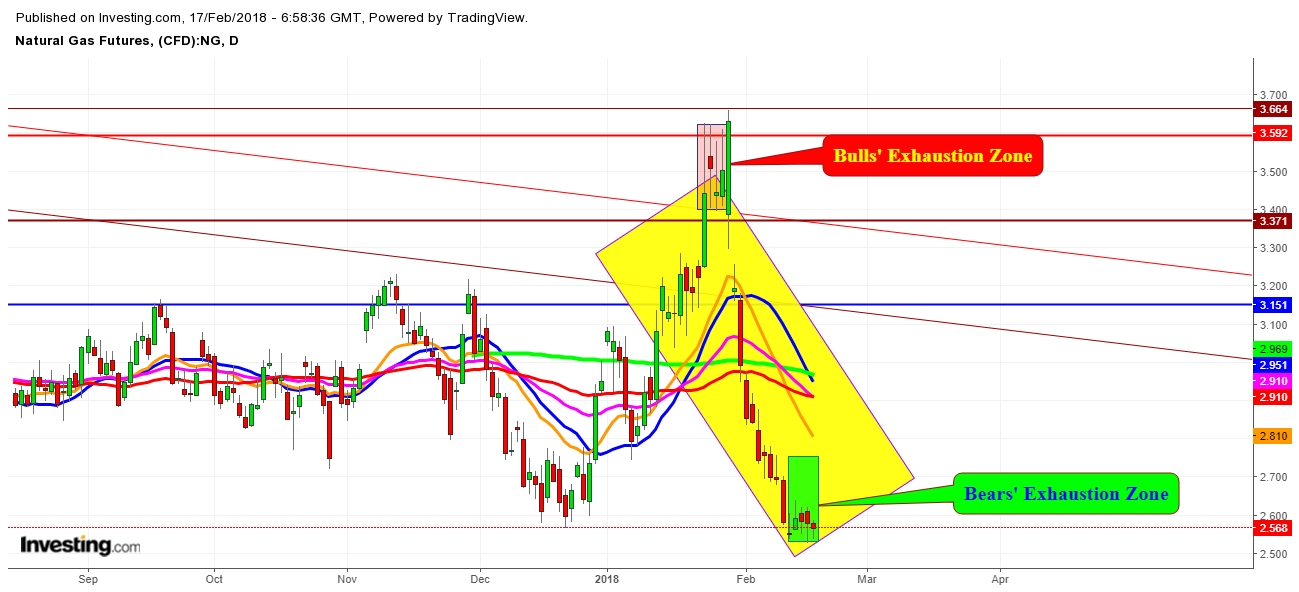
Natural Gas Futures Price Daily Chart - Exhaustion Zones

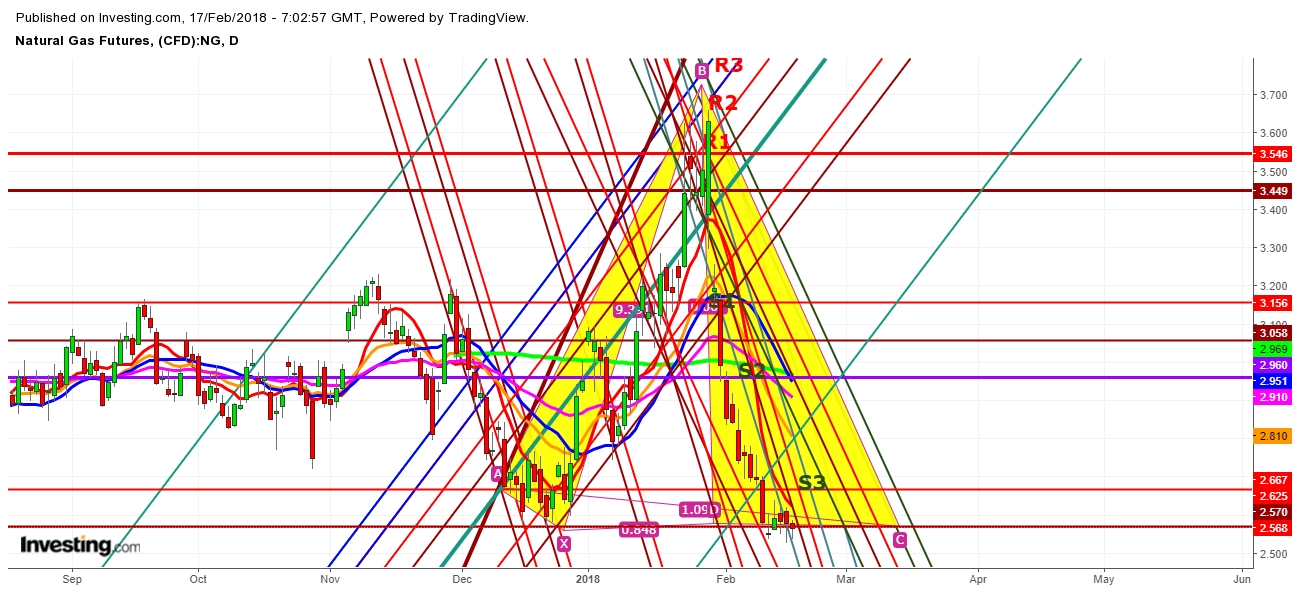
Natural Gas Futures Price Daily Chart - Support And Resistance Levels

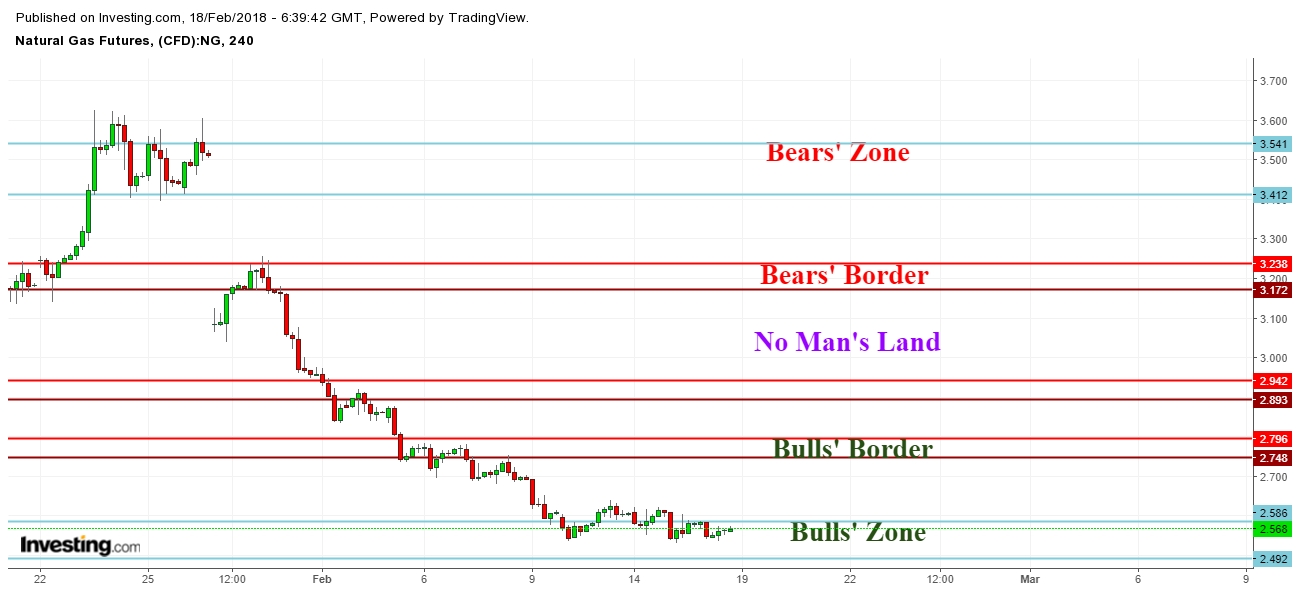
Natural Gas Futures Price 4 Hr. Chart - Territorial Zones

On analysis of the movement of Natural Gas futures price in different chart patterns which I have noted in my last few analyses, I find the reflection of the following factors upon the movement of Natural Gas futures price:

1. Antagonistic Weather model: Natural gas seems poised to create a sudden flip-flop during the upcoming weeks, as the forecast remained bearish till February 15th and then a potential flip seems to be taking place afterward.

2. The U.S. Energy Information Administration said in its weekly report that natural gas storage in the U.S. fell by 194 billion cubic feet (bcf) in the week ending Feb. 9, above forecasts for a withdrawal of 183 bcf. That compared with a decline of 119 bcf in the preceding week, a fall of 114 bcf a year earlier and a five-year average drop of 154 bcf.

3. Natural Gas Bullish Storage Data: Last hour’s short-covering and growing demand is evidence enough for natural gas bulls to take command.

4. Evidence of confusion among natural gas bears due to their reluctance to create fresh shorts at the level of $2.540.

Conclusion

3rd party Ad. Not an offer or recommendation by Investing.com. See disclosure here or remove ads .

1. History has witnessed several examples of steep reversals from the tops, when everybody wanted to create fresh buy positions at peaks; and on the other side, formation of explosive bounce from the lowest levels, when everybody was full of fear, even not to dare creating fresh long position at the lowest level.

2. Natural gas bears have completed their cocoon, and have been trapped inside, even ready to destroy their own cocoon themselves, which is evident from the put/call ratio for February contracts (0.77) and for March contracts (0.81) which explore more possibilities of a strong rally for some time before February 22nd, 2018 due to option expiration.

3. Gap-up opening on the first trading session for the Week of February 18th, 2018 will confirm the first blast in this bears’ cocoon.

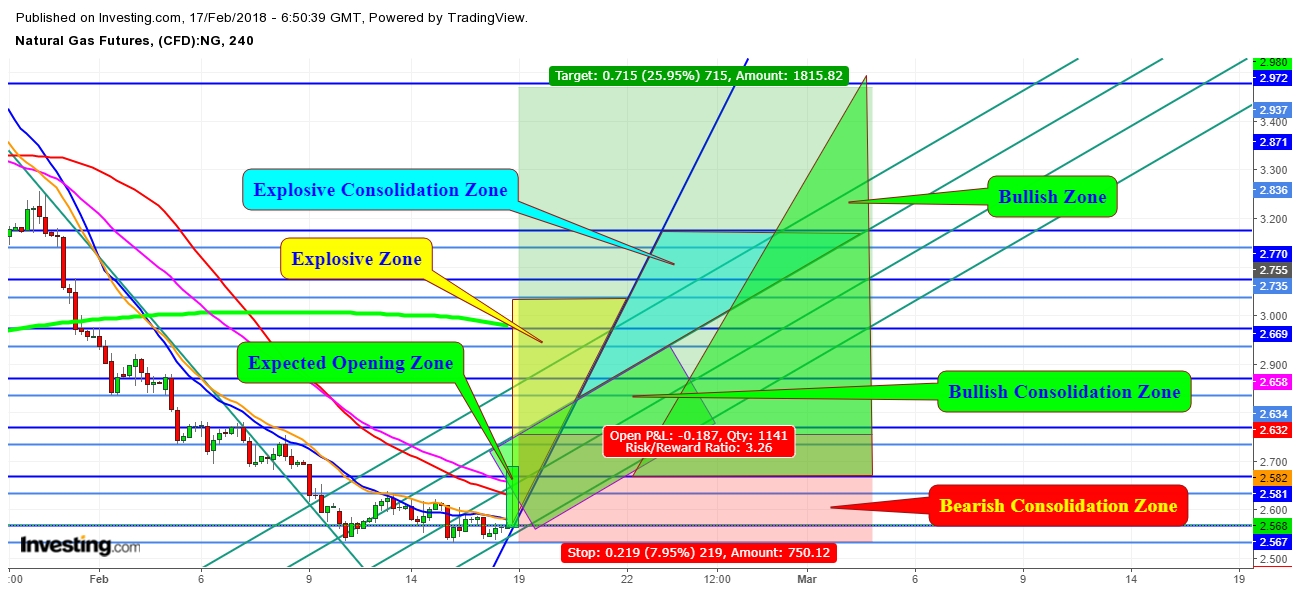
4. Finally, I conclude expected trading zones from February 18th – March 22nd, 2018.

Natural Gas Futures Price 4 Hr. Chart - Expected Trading Zone From February 18th To March 2nd, 2018

Latest comments

Fly like a peacock
Omg, that poor, tortured syntax...yikes
Snow storm is coming. Mother nature is on the way to save bulls
I agee like always still hold long position from 2.564
I agree.....
Oh No !,,,...
Risk Disclosure: Trading in financial instruments and/or cryptocurrencies involves high risks including the risk of losing some, or all, of your investment amount, and may not be suitable for all investors. Prices of cryptocurrencies are extremely volatile and may be affected by external factors such as financial, regulatory or political events. Trading on margin increases the financial risks.
Before deciding to trade in financial instrument or cryptocurrencies you should be fully informed of the risks and costs associated with trading the financial markets, carefully consider your investment objectives, level of experience, and risk appetite, and seek professional advice where needed.
Fusion Media would like to remind you that the data contained in this website is not necessarily real-time nor accurate. The data and prices on the website are not necessarily provided by any market or exchange, but may be provided by market makers, and so prices may not be accurate and may differ from the actual price at any given market, meaning prices are indicative and not appropriate for trading purposes. Fusion Media and any provider of the data contained in this website will not accept liability for any loss or damage as a result of your trading, or your reliance on the information contained within this website.
It is prohibited to use, store, reproduce, display, modify, transmit or distribute the data contained in this website without the explicit prior written permission of Fusion Media and/or the data provider. All intellectual property rights are reserved by the providers and/or the exchange providing the data contained in this website.
Fusion Media may be compensated by the advertisers that appear on the website, based on your interaction with the advertisements or advertisers.
© 2007-2024 - Fusion Media Limited. All Rights Reserved.