
Yesterday, using the Elliott Wave Principle, I showed where I expected the S&P 500 to go to over the next few days with a smaller top at around 3310-3320. See my article here.
So far, the index reached 3303 this morning—close enough?
With that in mind, allow me to use the same technique to assess what is most likely next for the Nasdaq 100. It is one of the few indexes (together with the NASDAQ and SOX) to make almost daily new all-time highs. I state "most likely" because nothing is ever for sure in the markets. It is all about probabilities of possibilities. But, by using the time-tested EWP and associated price-levels for each wave, one can get a reasonably accurate idea about the market's next few moves.
Figure 1. NDX100 daily candlestick chart with EWP count.
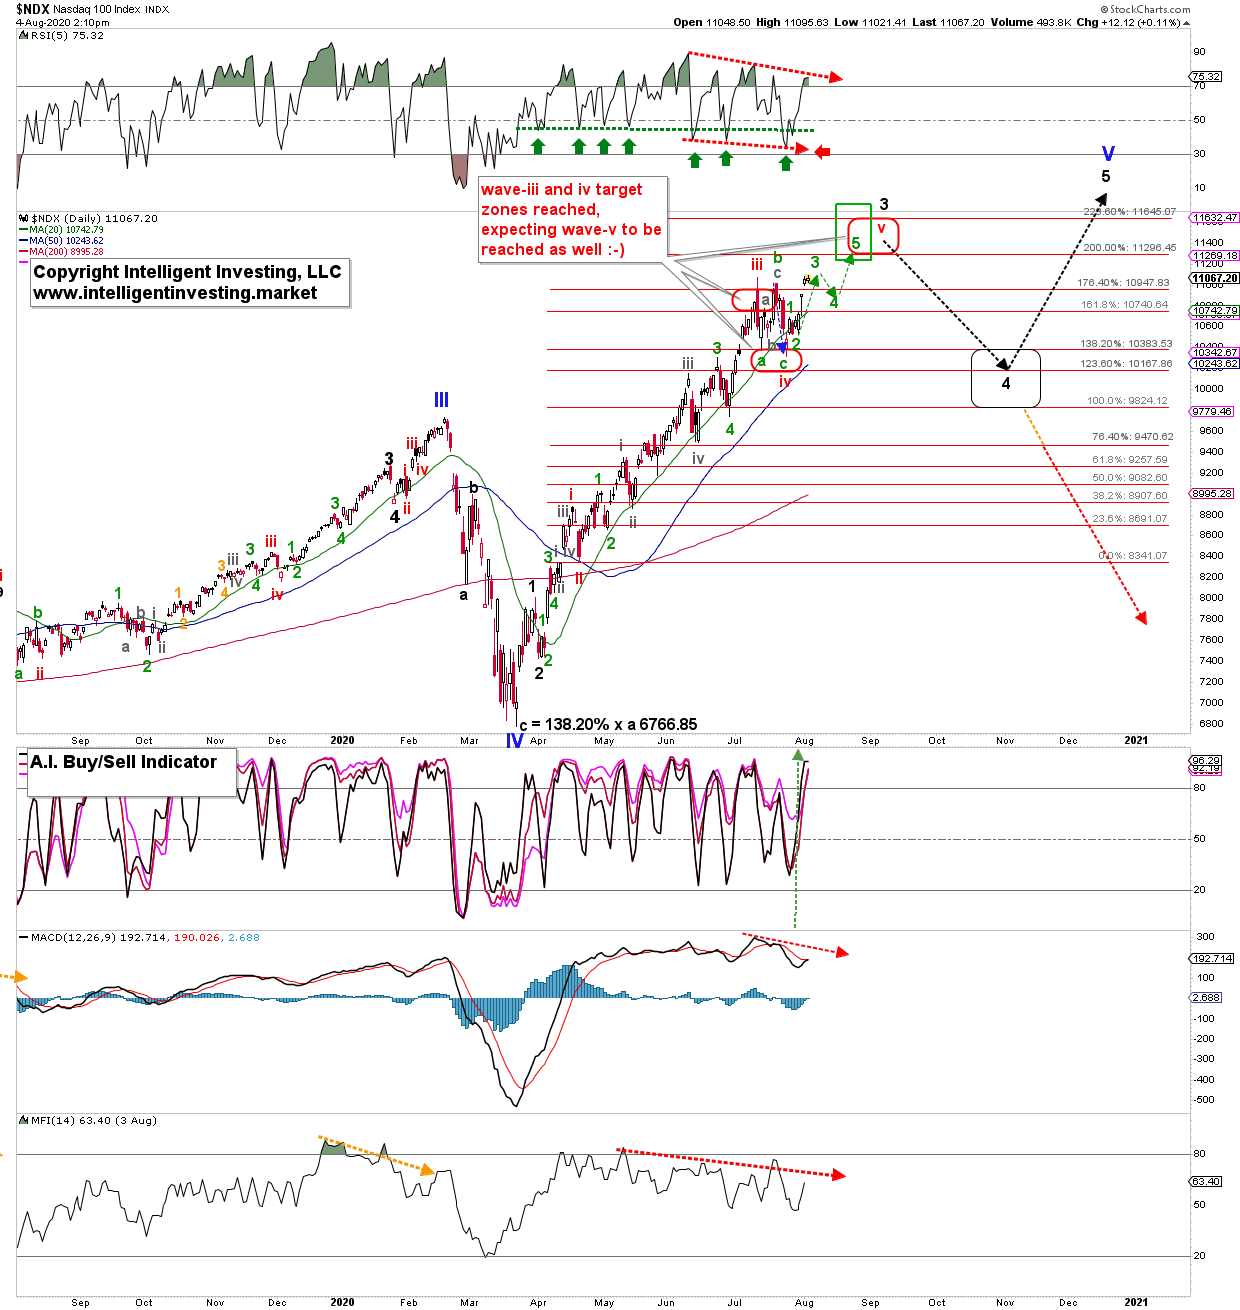
Like the S&P 500, the EWP suggests an impulse wave higher to ideally $11,295 is under way, but it can extend to as high as $11,750. Impulse moves always consist of five waves: in this case, green 1, 2, 3, 4, 5, of the red wave-iv low.
For now, the index is rapidly closing in on the ideal (green) wave-3 target level, and we should expect a brief one- to two-day pullback soon for (green) wave-4 before (green) wave-5 takes hold as shown with the green dotted arrows. Once this 5th wave completes, it completes a larger five-waves up (red i, ii, iii, iv, and v). This would fit well, with the more negatively diverging technical indicators (red dotted arrows). The index is moving higher on less momentum, and eventually the index will catch up with this divergence and start a more significant correction: black wave-4.
Please note how red wave-iii and wave-iv topped and bottomed, respectively, in the ideal target zones I forecast daily using EWP and Fibonacci-extension and -retrace levels. There is no randomness here or magic, but simply a market following mathematically precise and universal principles.
Once the index reaches the red target zone, I expect it to complete black wave-3. Then, as said, a more significant correction should unfold, ideally back to $10,385-9825 with the upper end preferred because,
in bull markets, the upside surprises and the downside disappoints. From that ideal wave-4 target zone, I anticipate the last black wave five up to new ATHs. It will, in turn, complete the impulse up off the March 23 low as well as the entire bull since 2009, possibly since 2002.
But let us not run too far ahead of ourselves, as that larger top will still be months out from now and instead focus on the current rally to around $11,295-11,750 first. Then we can see what happens from there and set our sails for the next two more significant moves: down and up.