Interest rates fell sharply at the end of the week, and while the immediate knee-jerk reaction would be that this was because of the CPI report. There was actually much more going on here.
Rates have been falling all over the world, from Japan to Germany, even China. This tells us that falling rates are not unique to the US and that, in reality, rates are falling in the US because foreign buyers are picking up US bonds as they offer much higher and more attractive yields.
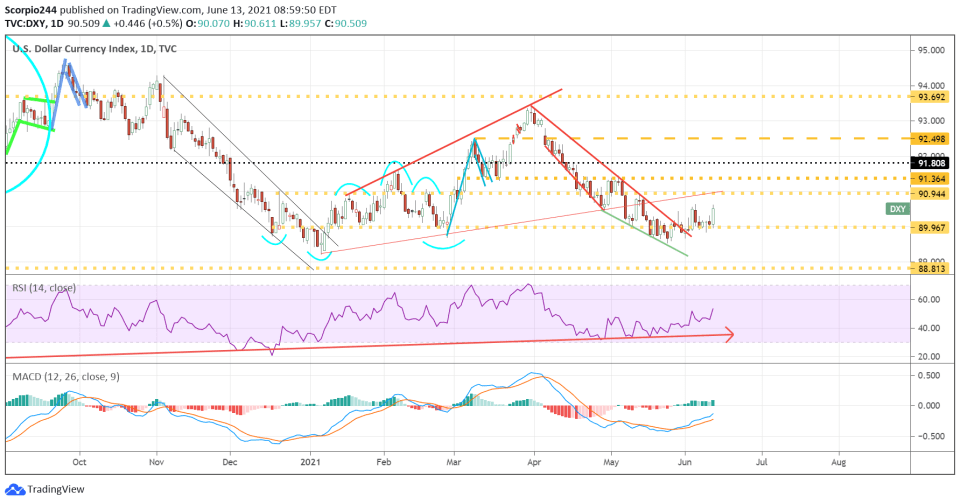
It could even help explain why the US dollar has suddenly spiked in recent days, as foreign bond buyers sell their local currency, buy dollars, and then buy US debt. It is probably why the dollar continues to rally back to 91 on the dollar index.
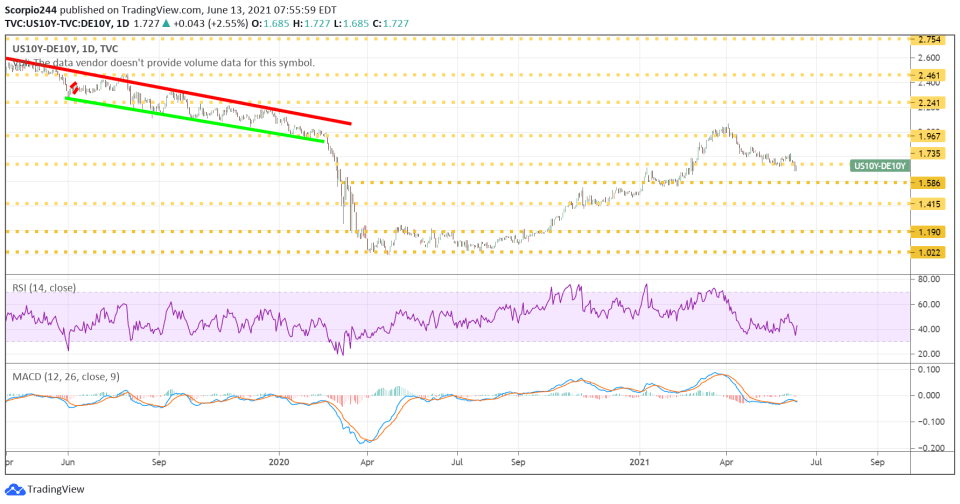
US/German Spread
The US/German 10-year spread has remained fairly constant, around 1.75% since the middle of May, despite the US rate falling by 20 bps to 1.45%. That is due to the German 10-year falling to -27 bps, from -7bps.
Of course, it probably doesn’t help that the ECB announced that it would continue to buy bonds at an accelerated pace on Thursday.
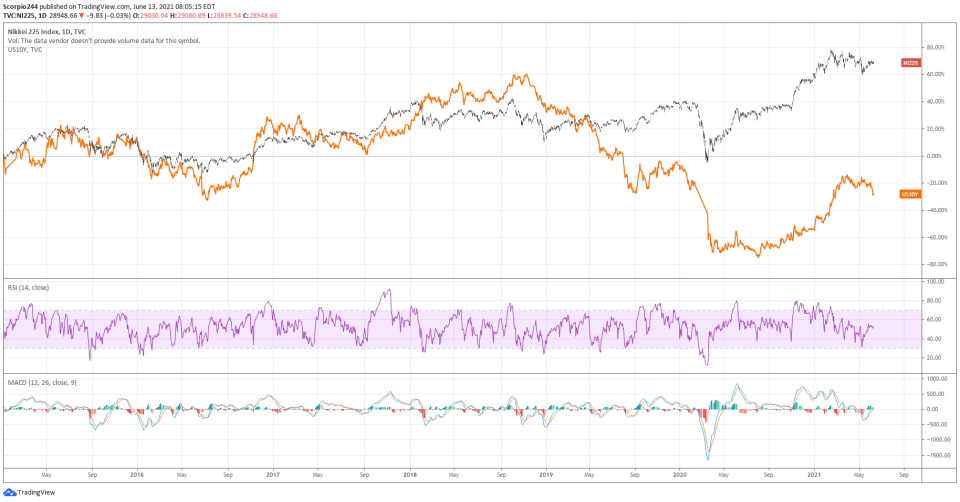
US 10 Vs. The Nikkei
The 10-Year may even be telling us what happens next to equity markets around the globe. The US 10-year and the Japanese Nikkei have a breathtaking correlation. If the US 10-year falls from here as it chases global rates lower than it seems, the Japanese Nikkei is to head lower too.
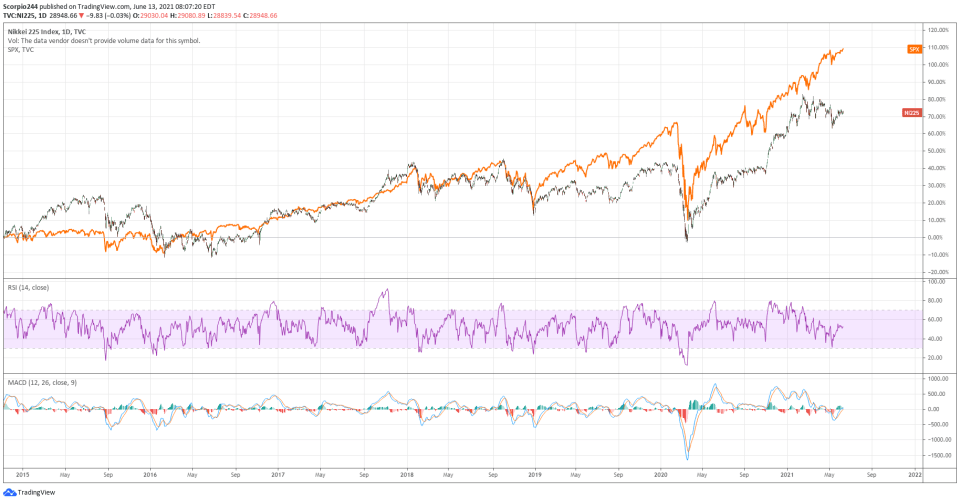
Nikkei To S&P 500
For the first time, the Nikkei and the S&P 500 are diverging by quite a bit.
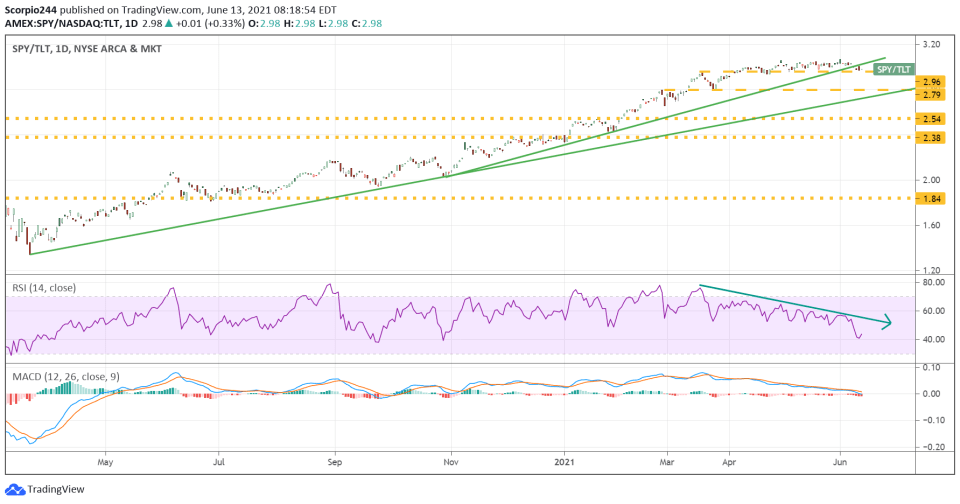
S&P 500 To Treasuries
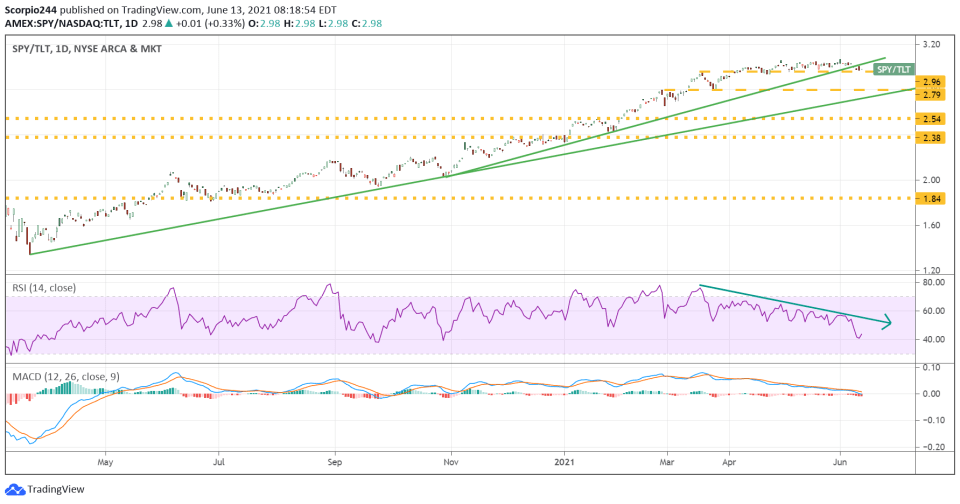
Meanwhile, the SPDR® S&P 500 (NYSE:SPY) to iShares 20+ Year Treasury Bond ETF (NASDAQ:TLT) ratio has broken an uptrend, and it will take a drop below 2.95 to confirm the bearish break in trend and what is likely to result in a big outperformance for the TLT relative to the SPY.
Financials
The Financial Select Sector SPDR® Fund (NYSE:XLF) had a rough week, with the ETF’s rising wedge pattern breaking lower as bond yields fell. The RSI and MACD signal a loss of momentum, with the next level of support coming around $36.60.
Dow Transports
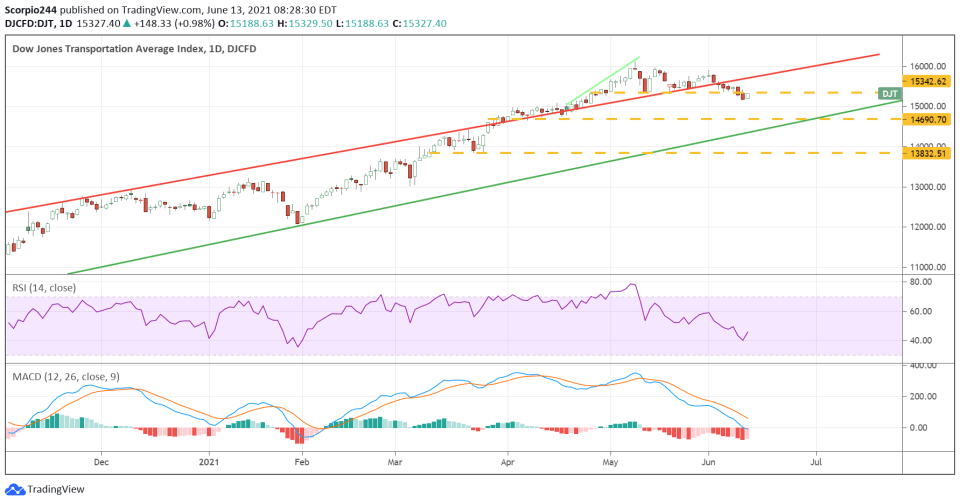
The Dow Jones Transportation also had a bad week, falling below support at 15,340. The next level of support comes at the lower trend line, around 14,690. The RSI and the MACD were suggesting that lower prices are coming for this index.
S&P 500
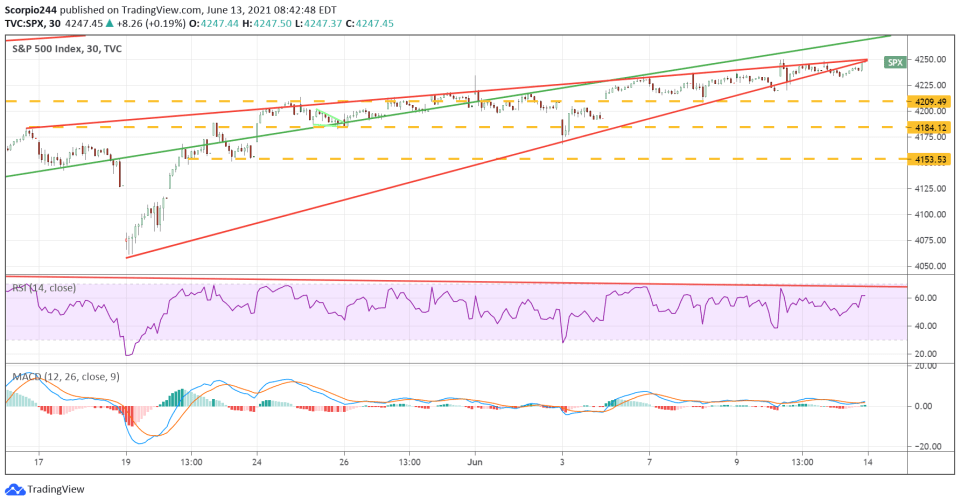
The S&P 500 broke the rising wedge again on Friday and retested that break at the end of the day. The big question is what’s next. The reason is that the rising wedge is finished, and we need to break one way or the other.
The XLF, as noted already, broke lower from its wedge, as has the housing index. It probably doesn’t speak well for the S&P 500. Monday morning will likely decide what happens next. It would not be surprising to see a reversion to the beginning of the wedge at 4070 over the next couple of weeks.
Intercontinental Exchange
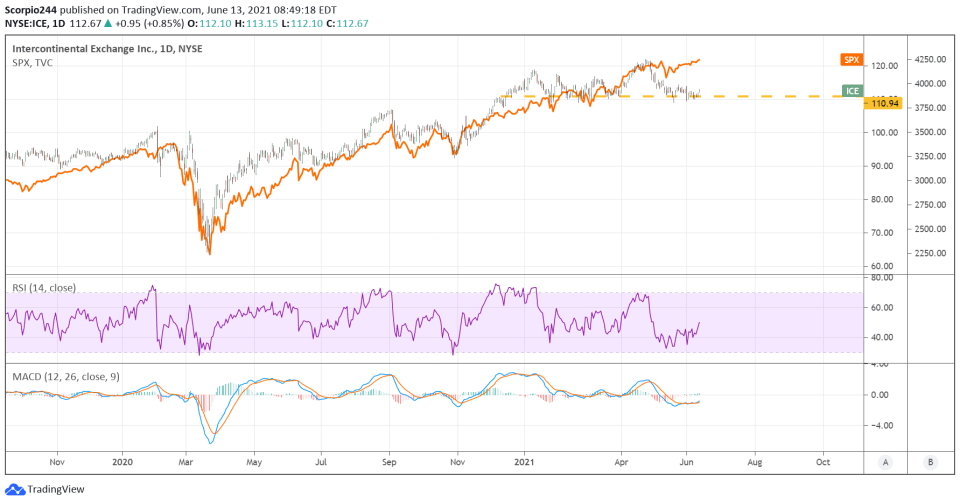
Intercontinental Exchange (NYSE:ICE) doesn’t diverge from the S&P 500 often, and we have to wonder what was happening here. Clearly, ICE was sitting on some key support at $110, and a break of that support isn’t likely to be positive for anyone.
Apple
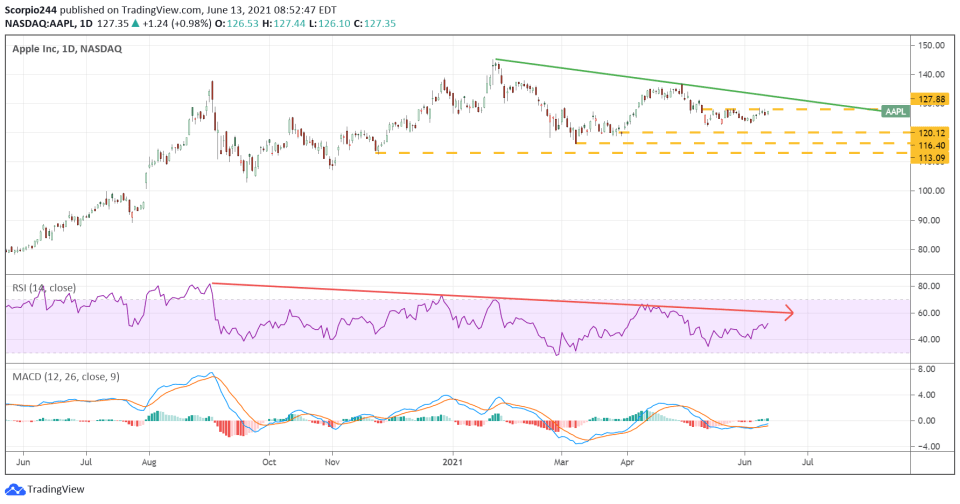
Apple (NASDAQ:AAPL) may see a move higher, but it isn’t likely to last long. There was a clear downtrend around a price of $132. Meanwhile, the RSI was also in a clear downtrend, as was the MACD, also suggesting any rally will be short-lived.
Citigroup
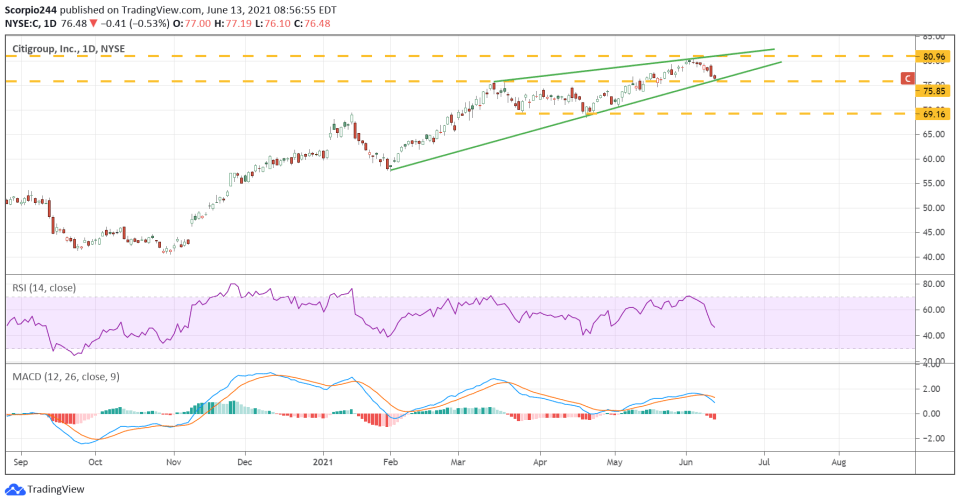
Citigroup (NYSE:C) was in a huge rising wedge pattern, and a break of that uptrend and drop below $75 is likely to send the shares to $69.
ACADIA
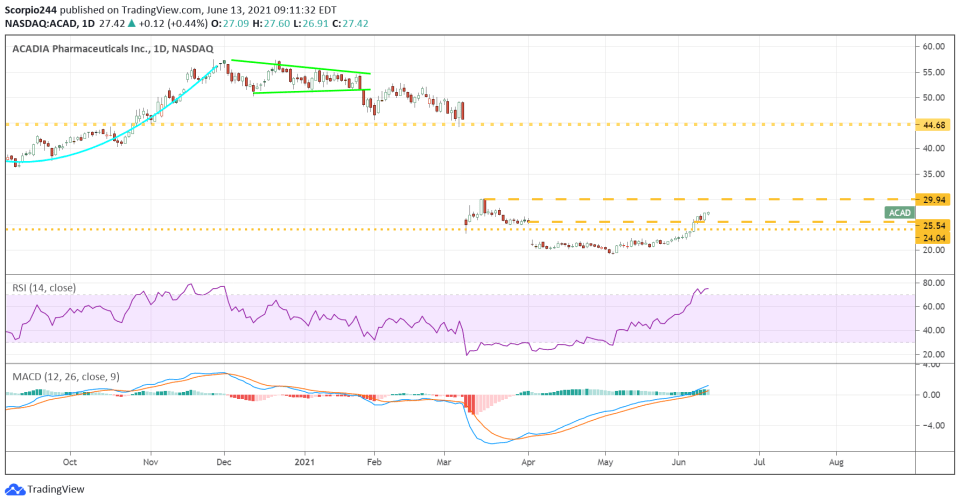
ACADIA Pharmaceuticals (NASDAQ:ACAD) moved higher last week following the positive Biogen (NASDAQ:BIIB) FDA approval. It doesn’t mean ACADIA's drug for Dementia-related psychosis has an easier path; it just means there may be hope for something positive when the company finally has that type-A meeting with the FDA.
Maybe ACADIA works out a way to resubmit the sNDA without having to run more trials. At this point, $30 would be really nice, considering how low it got.

