
MoneyGram International Inc.’s (NASDAQ:MGI) third-quarter earnings of 24 cents per share beat the Zacks Consensus Estimate by 118% but remained unchanged year over year. A decline in expenses aided results.
MoneyGram’s total revenues for the reported quarter were $347.2 million, down 13% on a reported basis and 12% on a constant currency, year over year. Revenues missed the Zacks Consensus Estimate by 8.9%.
Fees and other revenues decreased 56.4% to $333.7 million, while investment revenues increased 5.8% to $13.5 million.
Adjusted EBITDA margin of 17.1% remained flat year over year.
Total operating expenses declined by 14.7% year over year to $358.1 million.
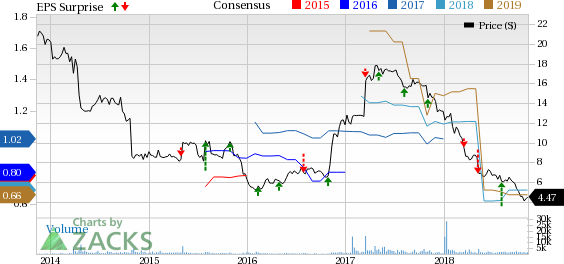
MoneyGram International Inc. Price, Consensus and EPS Surprise
Segment Details
In the Global Funds Transfer segment, money transfer revenues decreased 14% year over year to $304.2 million. Bill payment revenues also decreased 14% year over year to $17.4 million. Revenues include the impact of higher compliance standards and newly implemented corridor specific controls. MoneyGram.com revenues grew 3%. It was affected by enhanced compliance controls and introductory pricing.
Total digital solutions, which include MoneyGram.com, represented 16% of total money transfer revenues. Investment revenues benefited from higher yields and investment balances and grew 75% to $13.5 million.
The Financial Paper Products segment reported total revenues of $25.6 million, up 24% year over year due to a 9.4% uptick in money order revenues and a 46.8% increase in official check revenues. Adjusted operating margin improved 1480 basis points from the year-ago quarter to 37.5%.
Liquidity Position
As of Sep 30, 2018, MoneyGram had cash and cash equivalents of $208.8 million, up 9.8% from year-end 2017 levels. The company’s total assets were $4.5 billion, down 5.2% from year-end 2017 levels. The company exited the second quarter with $902 million of outstanding debt, down 0.7% from year-end 2017 levels.
Adjusted free cash flow for the first nine months of 2018 was $79.9 million, up 19% year over year.
Guidance Revised Down
The company is revising its full-year estimates for 2018. Revenues are expected to decline approximately 10% on a constant currency basis (compared with the earlier estimate of growth between 7% and 9%).
Adjusted EBITDA is expected to decline approximately 15% on a constant currency basis (compared with constant currency adjusted EBITDA growth projection in the range of 9-11%).
Zacks Rank
Currently, MoneyGram carries a Zacks Rank #3 (Hold). You can see the complete list of today’s Zacks #1 Rank (Strong Buy) stocks here.
Performance of Other Players in the Sector
The bottom line of American Express Co. (NYSE:AXP) , MasterCard Inc. (NYSE:MA) and Visa Inc. (NYSE:V) beat their respective Zacks Consensus Estimate for the quarter ending Sep 30, 2018.
The Hottest Tech Mega-Trend of All
Last year, it generated $8 billion in global revenues. By 2020, it's predicted to blast through the roof to $47 billion. Famed investor Mark Cuban says it will produce "the world's first trillionaires," but that should still leave plenty of money for regular investors who make the right trades early.
See Zacks' 3 Best Stocks to Play This Trend >>
American Express Company (AXP): Free Stock Analysis Report
MoneyGram International Inc. (MGI): Free Stock Analysis Report
Visa Inc. (V): Free Stock Analysis Report
Mastercard Incorporated (MA): Free Stock Analysis Report
Original post
Zacks Investment Research