Bitcoin price today: ticks down below $90k amid risk-off mood; key US data awaited

A warning does not necessarily have to become a full-blown sign to head for the exits. But it is, nevertheless, a warning.
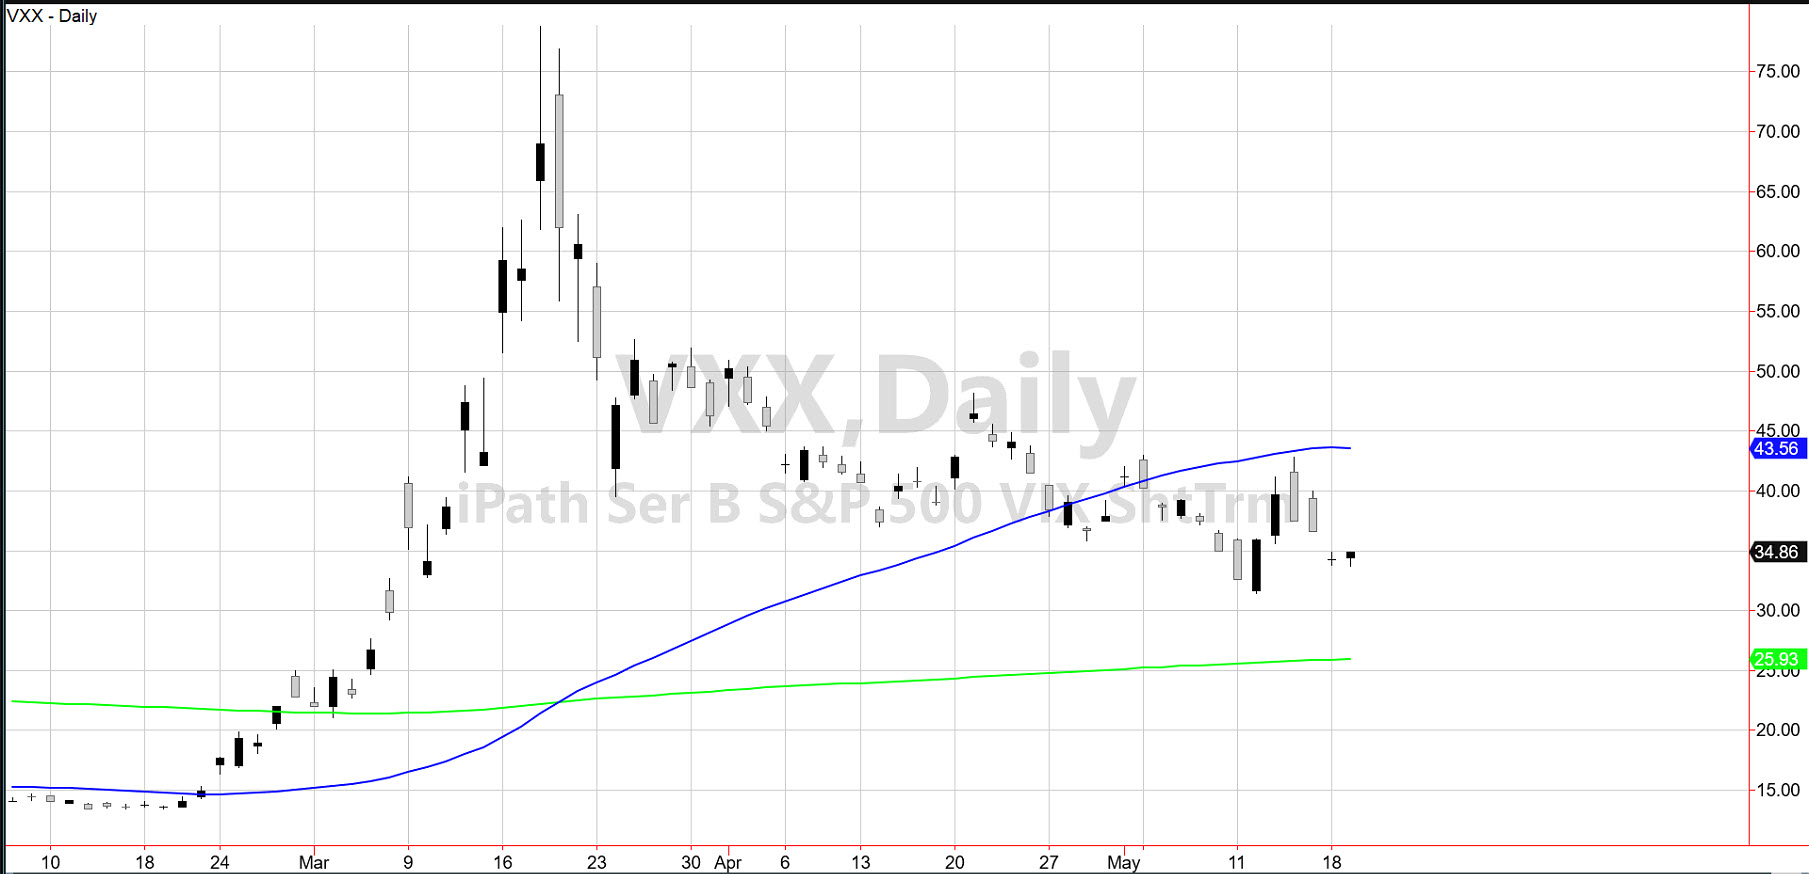
The last time I saw a warning from the iPath® Series B S&P 500® VIX Short-Term Futures™ ETN (NYSE:VXX) or the Volatility ETF, was in February.
Granted, on February 5th, the title of my daily post was “Volatility’s Inverted Hammer Doji Warning to Bulls,” and the current technical pattern is a bit different.
On Monday VXX had an inverted hammer doji pattern, while yesterday, VXX rallied and closed back over a key weekly exponential moving average. This does not surprise me either.
In early February, complacency ruled the day. Today, we are forewarned, hence forearmed.
Back in February I wrote:
“Although the last couple of days brought back euphoria into the market, with volatility hanging tough, one should be prepared for anything.”
And so it goes today.
With hopes of a vaccine, Moderna (NASDAQ:MRNA) ran up the market indices by over 5% in just 1 ½ days. In February, the stock traded at near $20 with a market cap of less than $10 billion.
In 4 months, the stock price rose to over $80 a share and the market cap increased by $26.61 billion. So typical of the recent market action.
Headlines drive price up by 500 points and down by 500 points as quickly as one can say vaccine. But the volatility index is smarter.
Even with the market trying to move beyond the resistance levels from April, VXX barely budged. It’s as if VXX knew that Moderna lacked key data needed to legitimize its progress on the vaccine.
VXX is in a caution phase and has a gap to fill at 36.60. That is the area we will be watching.
Key Levels
S&P 500 (SPDR S&P 500 (NYSE:SPY) 299.42 resistance with 288.30 support
Russell 2000 (iShares Russell 2000 ETF (NYSE:IWM)) 127.75 support with resistance 136.85
Dow (SPDR® Dow Jones Industrial Average ETF Trust (NYSE:DIA)) 239.50 support with resistance at 247.67
NASDAQ (Invesco (NYSE:IVZ) QQQ Trust (NASDAQ:QQQ)) Filled the gap to 229.32, then sold off. 223.50 support
SPDR® S&P Regional Banking ETF (NYSE:KRE) (Regional Banks) Prodigal doing prodigal-run and then slump back. 33.15 support
VanEck Vectors Semiconductor ETF (NYSE:SMH) (Semiconductors) 140 resistance 134 support
iShares Transportation Average ETF (NYSE:IYT) (Transportation) 150 resistance 140 support
iShares Nasdaq Biotechnology ETF (NASDAQ:IBB) (Biotechnology) A key reversal failure pattern today
SPDR® S&P Retail ETF (NYSE:XRT) (Retail) Could not hold 38.50 so looking 37.20 support
Volatility Index (VXX) 36.60 resistance to clear
Junk Bonds (SPDR® Bloomberg Barclays (LON:BARC) High Yield Bond ETF (NYSE:JNK)) 100 resistance 97.50 support
High Yield Bonds (iShares iBoxx $ Investment Grade Corporate Bond ETF (NYSE:LQD)) 130 resistance 127.50
