We saw more consolidation and chop for markets and stocks this past week while even good earnings numbers aren’t helping stocks move higher.
We started to see some weakness come into the market Thursday which has begun to rock the bulls.
I don’t think we will see too much of a correction, rather, just more chop as we build a base leading us into the fall, which is a seasonally strong time of the year.
I’m looking for some dip buys now but they may only be short-term trades of a few days.
More chop should dominate August so being very selective in trades and taking small positions will likely remain my strategy.
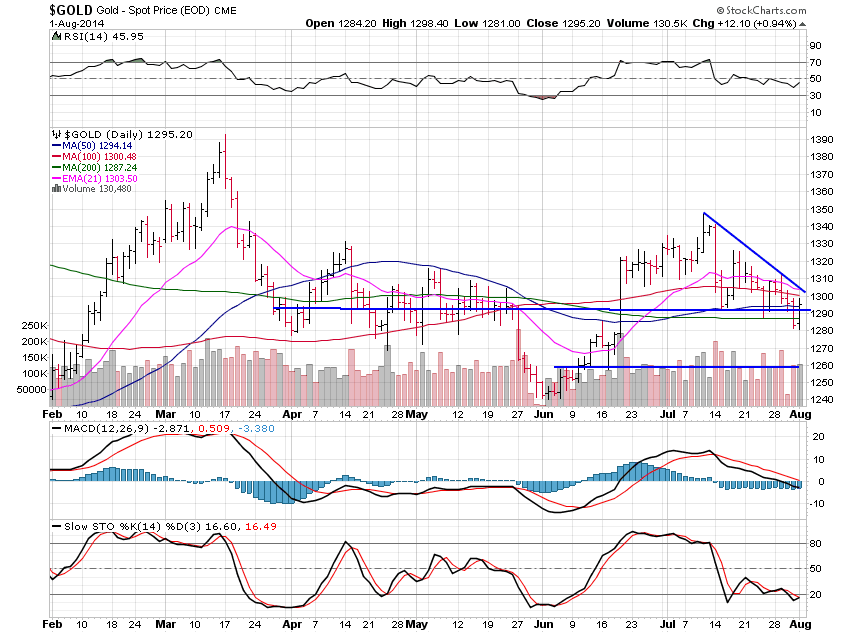
Gold tried to breakdown Thursday but saw some strength Friday which saved the day.
So far gold is holding up, but is not looking very strong overall.

Gold lost 1.02% this past week and is so far holding up, but barely.
This $1,290 to $1,280 area is key to hold and a move above $1,310 would signify the potential for more strength.
I’m not so sure gold can hold up here but you never know.
It’s acting very weak and choppy still and as a result is very dangerous.
For now, we remain choppy as has been the theme, but the strength we saw Friday is positive.
I have no interest in trying to trade gold for the moment.

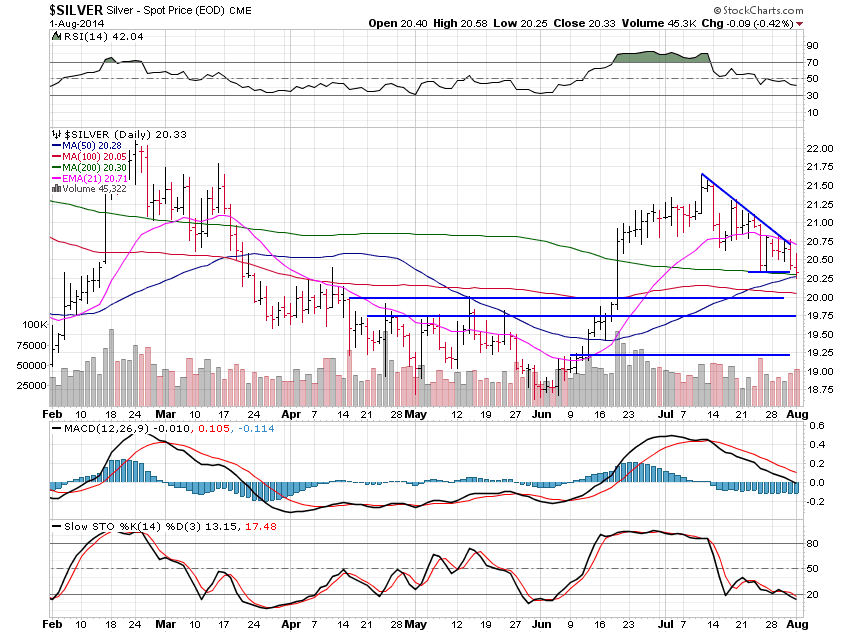
Silverlost 2.21% and looks much weaker than gold.
So far silver is holding the 200 day moving average but does look ready to roll over further now.
Support levels are below at $20, $19.75 then $19.25.
While Friday was positive for gold, it was very negative for silver and it looks like silver could be taking the reigns now to lead gold lower.
A move and close on a daily basis under $20.25 would confirm this and gold should then follow silver lower.

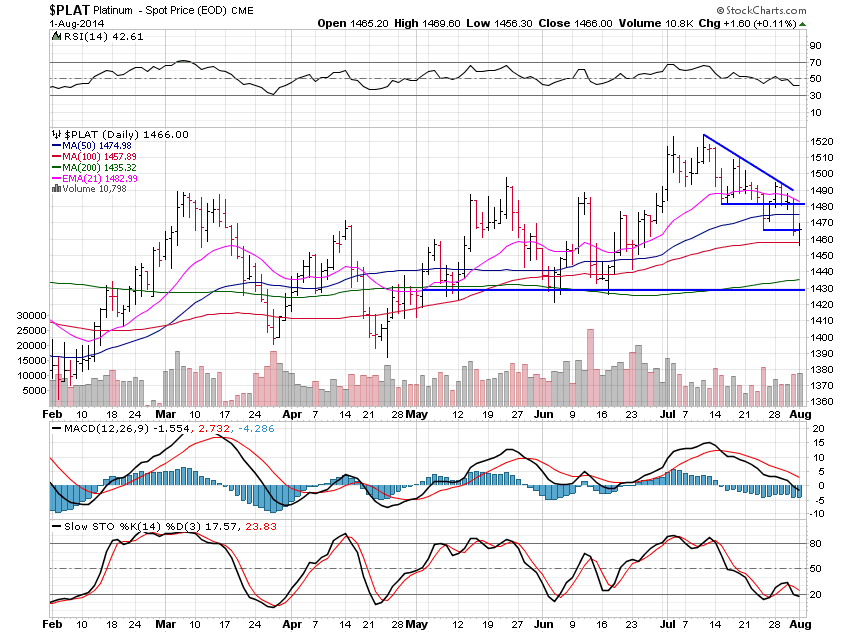
Platinumlost 1.15% for the week and is holding on by a thread for now.
A great bounce off the 100 day moving average is positive but the chart does suggest we have more to go on the downside.
The next support area for platinum is $1,430 and that could be hit in the week ahead easily.

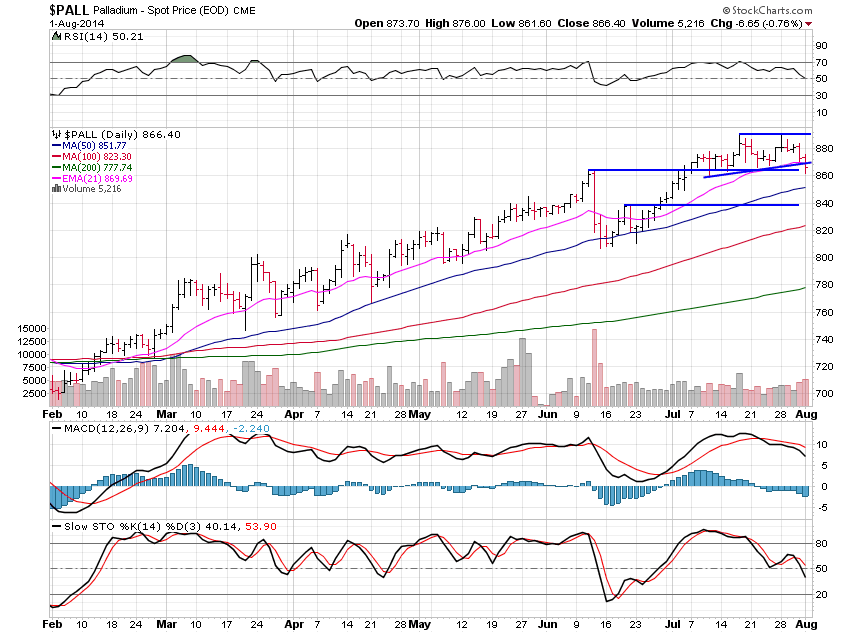
Palladium fell 1.61% and has to hold $860 or the next stop will be $840.
As strong as palladium has been, if gold is weak, palladium will follow.
Palladium has a bit of a double top in place now and with Friday’s weakness, the double top is almost confirmed. A break under $860 will confirm a double top.
All in all, precious metals are looking weak.
I still have not seen that blood in the streets sentiment that so often marks major lows for the precious metals and it could take quite some time for that moment to come.
With stocks still very strong in the big picture, the precious metals can remain week for another year or more.
The longer-term monthly gold chart (not shown)does suggest to me that the $1,000 area still needs to be tested before we can really consider gold to be ready for a trend change.
Thank you very much for reading and you can find out more about what I do for members as we focus on leading stocks for the most part at http://wizzentrading.com